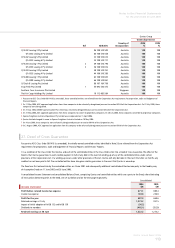
Qantas 2006 Annual Report Download - page 125
Download and view the complete annual report
Please find page 125 of the 2006 Qantas annual report below. You can navigate through the pages in the report by either clicking on the pages listed below, or by using the keyword search tool below to find specific information within the annual report.-
 1
1 -
2
-
3
-
4
-
5
-
6
-
7
-
8
-
9
-
10
-
11
-
12
-
13
-
14
-
15
-
16
-
17
-
18
-
19
-
20
-
21
-
22
-
23
-
24
-
25
-
26
-
27
-
28
-
29
-
30
-
31
-
32
-
33
-
34
-
35
-
36
-
37
-
38
-
39
-
40
-
41
-
42
-
43
-
44
-
45
-
46
-
47
-
48
-
49
-
50
-
51
-
52
-
53
-
54
-
55
-
56
-
57
-
58
-
59
-
60
-
61
-
62
-
63
-
64
-
65
-
66
-
67
-
68
-
69
-
70
-
71
-
72
-
73
-
74
-
75
-
76
-
77
-
78
-
79
-
80
-
81
-
82
-
83
-
84
-
85
-
86
-
87
-
88
-
89
-
90
-
91
-
92
-
93
-
94
-
95
-
96
-
97
-
98
-
99
-
100
-
101
-
102
-
103
-
104
-
105
-
106
-
107
-
108
-
109
-
110
-
111
-
112
-
113
-
114
-
 115
115 -
 116
116 -
 117
117 -
 118
118 -
 119
119 -
 120
120 -
 121
121 -
 122
122 -
 123
123 -
 124
124 -
 125
125 -
 126
126 -
 127
127 -
 128
128 -
 129
129 -
 130
130 -
 131
131 -
 132
132 -
 133
133 -
 134
134 -
 135
135 -
136
-
137
-
138
-
139
-
140
-
141
-
142
-
143
-
144
-
145
-
146
-
147
-
148
 |
 |
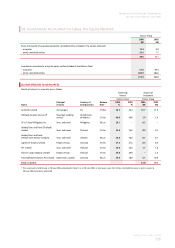
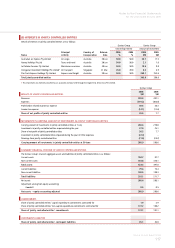
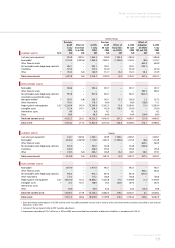
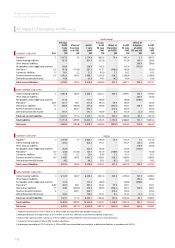
123
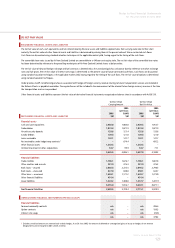
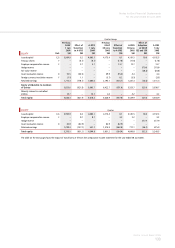
Qantas Annual Report 2006
Notes to the Financial Statements
for the year ended 30 June 2006
Qantas Jetstar
Qantas
Holidays
Qantas
Flight Catering Eliminations Consolidated
2006
$M
2005
$M
2006
$M
2005
$M
2006
$M
2005
$M
2006
$M
2005
$M
2006
$M
2005
$M
2006
$M
2005
$M
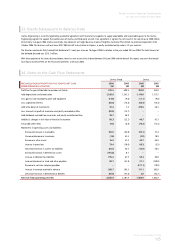
ANALYSIS BY BUSINESS SEGMENTS
Sales and other income
External segment revenue 12,107.8 11,241.1 649.9 440.2 719.4 707.8 169.6 174.8 ––13,646.7 12,563.9
Inter-segment revenue 287.1 254.7 52.7 75.4 190.0 233.7 365.1 377.3 (894.9) (941.1) ––
Total segment revenue 12,394.9 11,495.8 702.6 515.6 909.4 941.5 534.7 552.1 (894.9) (941.1) 13,646.7 12,563.9
Share of net profit of associates and jointly
controlled entities 38.7 15.7 – – 0.2 – – – ––38.9 15.7
Profit before related income tax expense and net
finance costs 648.2 903.2 10.8 35.6 29.8 50.9 37.0 24.3 – – 725.8 1,014.0
Net finance costs/(revenue) 69.8 112.4 ––(15.2) (12.6) –(0.1) ––54.6 99.7
Profit before related income tax expense 578.4 790.8 10.8 35.6 45.0 63.5 37.0124.4 ––671.2 914.3
Income tax expense 191.2 225.0
Profi t for the year 480.0 689.3
Depreciation and amortisation 1,231.2 1,223.7 9.4 7.4 1.4 2.0 7.8 8.2 ––1,249.8 1,241.3
Non-cash expense/(income) 8.7 (2.2) 0.5 0.1 –––(0.1) ––9.2 (2.2)
Assets
Segment assets 18,414.2 17,423.1 152.1 207.7 376.9 341.8 301.7 283.1 (434.5) (221.3) 18,810.4 18,034.4
Investments accounted for using the equity method 371.1 354.6 – – 1.8 1.4 – – – – 372.9 356.0
Total assets 18,785.3 17,777.7 152.1 207.7 378.7 343.2 301.7 283.1 (434.5) (221.3) 19,183.3 18,390.4
Liabilities
Total liabilities 12,977.2 12,387.0 145.4 275.5 225.0 223.2 189.1 196.1 (434.5) (221.3) 13,102.2 12,860.5
Payments for property, plant and equipment 1,496.2 1,761.6 26.2 36.0 0.2 2.6 4.5 6.1 – – 1,527.1 1,806.3
1 Changes in allocation of overhead resulted in a reduction of $11.8 million in the segment charge borne by QFCL and recovered by Qantas, compared to the previous year.