Qantas 2006 Annual Report Download - page 49
Download and view the complete annual report
Please find page 49 of the 2006 Qantas annual report below. You can navigate through the pages in the report by either clicking on the pages listed below, or by using the keyword search tool below to find specific information within the annual report.-
 1
1 -
2
-
3
-
4
-
5
-
6
-
7
-
8
-
9
-
10
-
11
-
12
-
13
-
14
-
15
-
16
-
17
-
18
-
19
-
20
-
21
-
22
-
23
-
24
-
25
-
26
-
27
-
28
-
29
-
30
-
31
-
32
-
33
-
34
-
35
-
36
-
37
-
38
-
 39
39 -
 40
40 -
 41
41 -
 42
42 -
 43
43 -
 44
44 -
 45
45 -
 46
46 -
 47
47 -
 48
48 -
 49
49 -
 50
50 -
 51
51 -
 52
52 -
 53
53 -
 54
54 -
 55
55 -
 56
56 -
 57
57 -
 58
58 -
 59
59 -
60
-
61
-
62
-
63
-
64
-
65
-
66
-
67
-
68
-
69
-
70
-
71
-
72
-
73
-
74
-
75
-
76
-
77
-
78
-
79
-
80
-
81
-
82
-
83
-
84
-
85
-
86
-
87
-
88
-
89
-
90
-
91
-
92
-
93
-
94
-
95
-
96
-
97
-
98
-
99
-
100
-
101
-
102
-
103
-
104
-
105
-
106
-
107
-
108
-
109
-
110
-
111
-
112
-
113
-
114
-
115
-
116
-
117
-
118
-
119
-
120
-
121
-
122
-
123
-
124
-
125
-
126
-
127
-
128
-
129
-
130
-
131
-
132
-
133
-
134
-
135
-
136
-
137
-
138
-
139
-
140
-
141
-
142
-
143
-
144
-
145
-
146
-
147
-
148
 |
 |

47
Qantas Annual Report 2006
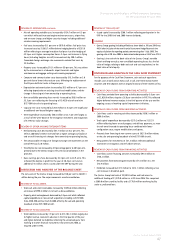
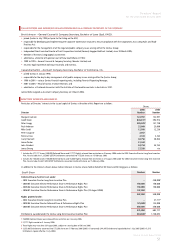
REVIEW OF EXPENDITURE CONTINUED
• Aircraft operating variable costs increased by $154.7 million or 6.5 per
cent which reflected increased engine maintenance costs, airport fees
and en-route charges and higher security charges including additional
airside screening requirements.
• Fuel costs increased by 45.1 per cent or $870.6 million. Fuel price rises
increased costs by $1,065.7 million before hedging benefits of $281.6
million reflecting an average into-plane fuel price rise after hedging of
42.5 per cent. Higher consumption from a 3.4 per cent increase in flying
hours (including freighter aircraft) increased costs by $90.2 million.
Favourable foreign exchange rate movements reduced fuel costs by
$2.8 million.
• Property costs increased by $18.1 million or 6.0 per cent. This was driven
by the increased rents at domestic airport terminals and higher
maintenance on baggage sorting and screening equipment.
• Computer and communication costs decreased by $15.3 million or 3.0
per cent due to lower infrastructure costs following the replacement of
the 30-year old Data Centre in the prior year.
• Depreciation and amortisation increased by $8.5 million or 0.7 per cent
reflecting depreciation on existing aircraft and modifications and the
change in financing mix from ownership to operating lease.
• Non-cancellable operating lease rentals increased by $88.9 million or
33.3 per cent reflecting the financing of 15 A320 aircraft and nine
B737-800 aircraft via operating lease.
• Capacity hire costs increased by $28.6 million or 8.4 per cent largely due
to additional wet-leased freighter capacity.
• Other expenditure increased by $86.4 million or 22.7 per cent largely as
a result of the write-down of the Orangestar investment and recognition
of A-IFRS fair value changes.
REVIEW OF OTHER INCOME STATEMENT ITEMS
• Net borrowing costs decreased by $45.1 million or 45.2 per cent. This
reflects additional interest received from a higher average cash balance
and aircraft financing mix changes from ownership to operating leasing.
• The unfavourable net impact of foreign exchange rate movements on the
overall PBT was $2.0 million.
• The effective tax rate increased by 3.9 percentage points to 28.5 per cent,
primarily due to the Qantas Group’s entry into tax consolidations in the
prior year.
• Basic earnings per share decreased by 32.3 per cent to 24.9 cents. This
reflected the decline in profit for the year of 30.4 per cent and an
additional 55 million shares issued under the DRP during the year.
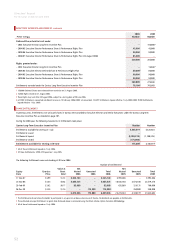
DISCUSSION AND ANALYSIS OF THE BALANCE SHEET
The net assets of the Qantas Group increased by 10.0 per cent to $6,081.1
million during the year. The major movements are discussed below.
REVIEW OF TOTAL ASSETS
• Total cash and current receivables increased by $1,096.6 million refl ecting
an increase of $998.2 million in net cash as discussed below.
• Property, plant and equipment decreased by 2.4 per cent which refl ected
capital expenditure on new aircraft acquisitions including six B737-800,
three A330-300 and four Dash 8-Q400, offset by the sale and operating
leaseback of nine B737-800 aircraft.
REVIEW OF TOTAL LIABILITIES
• Total liabilities increased by 1.9 per cent to $13,102.2 million largely due
to higher revenue received in advance in the final quarter of the year
and higher deferred tax liabilities reflecting the unrealised gains from
marking to market financial instruments held at 30 June 2006, as
required under A-IFRS.
REVIEW OF TOTAL EQUITY
• Issued capital increased by $200.7 million reflecting participation in the
DRP for the 2005 final and 2006 interim dividends.
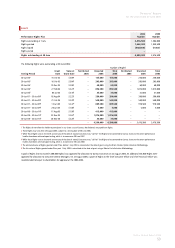
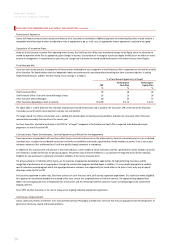
GEARING
• Qantas Group gearing (including off balance sheet debt) at 30 June 2006 was
44:56 after inclusion of the new fi nancial instrument Hedge Reserve in the
equity calculation for reporting periods commencing after 1 July 2005. The
gearing ratio at 30 June 2005 as determined under previous GAAP was 47:53.
• Gearing is the ratio of the book value of the Qantas Group’s net debt
(short and long-term plus non-cancellable operating leases less the fair
value of hedges relating to debt and cash and cash equivalents) to the
book value of total equity.
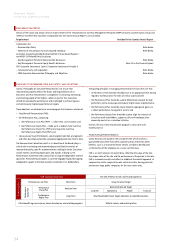
DISCUSSION AND ANALYSIS OF THE CASH FLOW STATEMENT
For the purposes of the Cash Flow Statement, cash and cash equivalents
includes cash at bank and on hand, cash at call, short-term money market
securities and term deposits with an original maturity of three months or less.
REVIEW OF CASH FLOWS FROM OPERATING ACTIVITIES
• Cash flows provided from operating activities decreased by 3.6 per cent
to $2,026.0 million, despite a 26.6 per cent decline in PBT. This reflected
higher deferred revenue receipts in the final quarter of the year and the
ongoing success of working capital improvement initiatives.
REVIEW OF CASH FLOWS FROM INVESTING ACTIVITIES
• Cash flows used in investing activities decreased by $630.1 million to
$889.6 million.
• Total capital expenditure decreased by $279.2 million to $1,527.1
million reflecting lower aircraft progress and delivery payments, as more
aircraft were financed via operating lease combined with lower
configuration costs, engine modifications and spares.
• Proceeds from financing of non-current assets of $627.8 million relates
to the sale and operating leaseback of nine B737-800 aircraft.
• Net payments for investments of $37.3 million reflected additional
investment in Orangestar and Jet Turbine Services.
REVIEW OF CASH FLOWS FROM FINANCING ACTIVITIES
• Cash fl ows used in fi nancing activities increased by $94.5 million to
$138.2 million.
• Net proceeds from borrowing decreased by $57.4 million to a net
$73.9 million.
• Dividends increased by $37.3 million to $212.1 million reflecting a two
cent increase in dividends paid.
The Qantas Group held cash of $2,902.0 million and had access to
additional funding of $1,270.0 million as at 30 June 2006. This comprised
a $500.0 million stand-by facility and a $770.0 million revolving facility
under a syndicated loan.
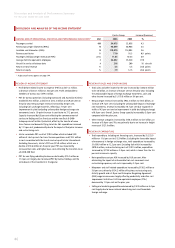
Discussion and Analysis of Performance Summary
for the year ended 30 June 2006