Qantas 2006 Annual Report Download - page 145
Download and view the complete annual report
Please find page 145 of the 2006 Qantas annual report below. You can navigate through the pages in the report by either clicking on the pages listed below, or by using the keyword search tool below to find specific information within the annual report.-
 1
1 -
2
-
3
-
4
-
5
-
6
-
7
-
8
-
9
-
10
-
11
-
12
-
13
-
14
-
15
-
16
-
17
-
18
-
19
-
20
-
21
-
22
-
23
-
24
-
25
-
26
-
27
-
28
-
29
-
30
-
31
-
32
-
33
-
34
-
35
-
36
-
37
-
38
-
39
-
40
-
41
-
42
-
43
-
44
-
45
-
46
-
47
-
48
-
49
-
50
-
51
-
52
-
53
-
54
-
55
-
56
-
57
-
58
-
59
-
60
-
61
-
62
-
63
-
64
-
65
-
66
-
67
-
68
-
69
-
70
-
71
-
72
-
73
-
74
-
75
-
76
-
77
-
78
-
79
-
80
-
81
-
82
-
83
-
84
-
85
-
86
-
87
-
88
-
89
-
90
-
91
-
92
-
93
-
94
-
95
-
96
-
97
-
98
-
99
-
100
-
101
-
102
-
103
-
104
-
105
-
106
-
107
-
108
-
109
-
110
-
111
-
112
-
113
-
114
-
115
-
116
-
117
-
118
-
119
-
120
-
121
-
122
-
123
-
124
-
125
-
126
-
127
-
128
-
129
-
130
-
131
-
132
-
133
-
134
-
 135
135 -
 136
136 -
 137
137 -
 138
138 -
 139
139 -
 140
140 -
 141
141 -
 142
142 -
 143
143 -
 144
144 -
 145
145 -
 146
146 -
 147
147 -
 148
148
 |
 |

143
Qantas Annual Report 2006
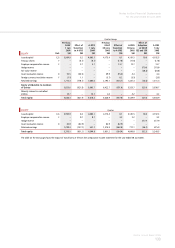
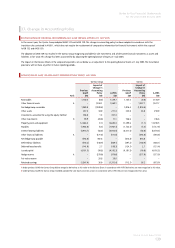
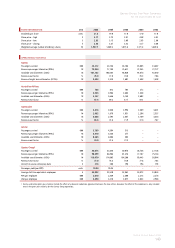
SHARE INFORMATION Unit 2006 2005 2004 2003 2002
Dividends per share cents 21.0 19.0 17.0 17.0 17.0
Share price – high $ 4.17 3.73 3.81 4.88 4.92
Share price – low $ 2.93 3.13 3.08 2.85 2.60
Share price – closing $ 2.96 3.37 3.52 3.27 4.60
Weighted average number of ordinary shares M 1,927.7 1,869.2 1,815.4 1,721.2 1,469.4
OPERATIONAL STATISTICS
Qantas
Passengers carried 000 24,212 24,734 26,106 25,085 23,487
Revenue passenger kilometres (RPKs) M 78,844 77,198 75,621 73,355 72,777
Available seat kilometres (ASKs) M 101,102 100,265 96,020 93,674 92,610
Revenue seat factor % 78.0 77.0 78.8 78.3 78.6
Revenue freight tonne kilometres (RFTKs) M 2,633 2,329 1,601 1,598 1,598
Australian Airlines
Passengers carried 000 748 812 705 272 –
Revenue passenger kilometres (RPKs) M 3,553 3,906 3,485 1,538 –
Available seat kilometres (ASKs) M 5,257 5,646 5,148 2,602 –
Revenue seat factor % 67.6 69.2 67.7 59.1 –
QantasLink
Passengers carried 000 3,316 3,058 2,996 3,389 3,641
Revenue passenger kilometres (RPKs) M 2,092 1,879 1,931 2,294 2,357
Available seat kilometres (ASKs) M 3,048 2,595 2,687 3,169 3,334
Revenue seat factor % 68.6 72.4 71.9 72.4 70.7
Jetstar
Passengers carried 000 5,799 4,384 315 – –
Revenue passenger kilometres (RPKs) M 6,410 4,346 277 – –
Available seat kilometres (ASKs) M 8,663 6,004 383 – –
Revenue seat factor % 74.0 72.4 72.3 – –
Qantas Group1
Passengers carried 000 34,075 32,658 30,076 28,746 27,128
Revenue passenger kilometres (RPKs) M 90,899 86,986 81,276 77,187 75,134
Available seat kilometres (ASKs) M 118,070 114,003 104,200 99,445 95,944
Revenue seat factor % 77.0 76.3 78.0 77.6 78.3
Aircraft in service at balance date # 216 200 190 196 193
Passenger yield (per RPK) cents 10.94 10.34 – – –
Average full-time equivalent employees # 34,832 35,520 33,862 34,872 33,044
RPK per employee 000 2,610 2,449 2,400 2,213 2,274
ASK per employee 000 3,390 3,210 3,077 2,852 2,904
1 Qantas and Jetstar prior year statistics include the effect of a domestic codeshare agreement between the two airlines. However, the effect of this codeshare is only included
once in the prior year statistics for the Qantas Group operations.
Qantas Group Five-Year Summary
for the years ended 30 June