Qantas 2006 Annual Report Download - page 70
Download and view the complete annual report
Please find page 70 of the 2006 Qantas annual report below. You can navigate through the pages in the report by either clicking on the pages listed below, or by using the keyword search tool below to find specific information within the annual report.-
 1
1 -
2
-
3
-
4
-
5
-
6
-
7
-
8
-
9
-
10
-
11
-
12
-
13
-
14
-
15
-
16
-
17
-
18
-
19
-
20
-
21
-
22
-
23
-
24
-
25
-
26
-
27
-
28
-
29
-
30
-
31
-
32
-
33
-
34
-
35
-
36
-
37
-
38
-
39
-
40
-
41
-
42
-
43
-
44
-
45
-
46
-
47
-
48
-
49
-
50
-
51
-
52
-
53
-
54
-
55
-
56
-
57
-
58
-
59
-
 60
60 -
 61
61 -
 62
62 -
 63
63 -
 64
64 -
 65
65 -
 66
66 -
 67
67 -
 68
68 -
 69
69 -
 70
70 -
 71
71 -
 72
72 -
 73
73 -
 74
74 -
 75
75 -
 76
76 -
 77
77 -
 78
78 -
 79
79 -
 80
80 -
81
-
82
-
83
-
84
-
85
-
86
-
87
-
88
-
89
-
90
-
91
-
92
-
93
-
94
-
95
-
96
-
97
-
98
-
99
-
100
-
101
-
102
-
103
-
104
-
105
-
106
-
107
-
108
-
109
-
110
-
111
-
112
-
113
-
114
-
115
-
116
-
117
-
118
-
119
-
120
-
121
-
122
-
123
-
124
-
125
-
126
-
127
-
128
-
129
-
130
-
131
-
132
-
133
-
134
-
135
-
136
-
137
-
138
-
139
-
140
-
141
-
142
-
143
-
144
-
145
-
146
-
147
-
148
 |
 |

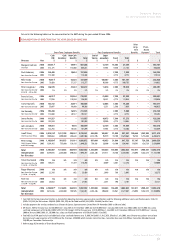
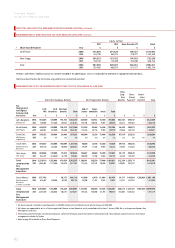
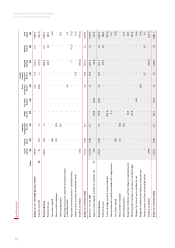
68
Qantas Group Qantas
Notes
2006
$M
2005
$M
2006
$M
2005
$M
SALES AND OTHER INCOME
Net passenger revenue 10,504.0 9,571.6 8,982.7 8,320.2
Net freight revenue 887.8 759.9 887.2 759.4
Tours and travel revenue 719.4 707.8 ––
Contract work revenue 469.0 484.9 359.4 367.0
Other 1,066.5 1,039.7 1,085.3 970.6
Sales and other income 2 13,646.7 12,563.9 11,314.6 10,417.2
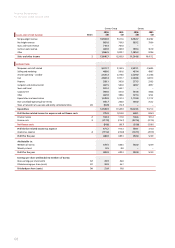
EXPENDITURE
Manpower and staff related 3,321.7 3,163.5 2,681.1 2,560.5
Selling and marketing 469.6 501.6 457.4 480.7
Aircraft operating – variable 2,525.3 2,370.6 2,229.0 2,128.6
Fuel 2,802.3 1,931.7 2,434.8 1,691.3
Property 320.1 302.0 277.3 259.3
Computer and communication 487.5 502.8 420.7 409.7
Tours and travel 591.2 563.7 ––
Capacity hire 369.6 341.0 341.8 346.6
Other 467.0 380.6 377.4 325.2
Depreciation and amortisation 1,249.8 1,241.3 1,110.0 1,117.2
Non-cancellable operating lease rentals 355.7 266.8 345.0 252.2
Share of net profit of associates and jointly controlled entities 28 (38.9) (15.7) ––
Expenditure 12,920.9 11,549.9 10,674.5 9,571.3
Profi t before related income tax expense and net fi nance costs 725.8 1,014.0 640.1 845.9
Finance income 2 163.3 117.0 146.6 101.4
Finance costs 3 (217.9) (216.7) (227.6) (221.5)
Net fi nance costs (54.6) (99.7) (81.0) (120.1)
Profi t before related income tax expense 671.2 914.3 559.1 725.8
Income tax expense 4 (191.2) (225.0) (167.1) (201.9)
Profi t for the year 480.0 689.3 392.0 523.9
Attributable to:
Members of Qantas 479.5 688.5 392.0 523.9
Minority interest 0.5 0.8 ––
Profi t for the year 480.0 689.3 392.0 523.9
Earnings per share attributable to members of Qantas:
Basic earnings per share (cents) 32 24.9 36.8
Diluted earnings per share (cents) 32 24.8 36.7
Dividend per share (cents) 30 21.0 19.0
Income Statements
for the year ended 30 June 2006