Qantas 2006 Annual Report Download - page 105
Download and view the complete annual report
Please find page 105 of the 2006 Qantas annual report below. You can navigate through the pages in the report by either clicking on the pages listed below, or by using the keyword search tool below to find specific information within the annual report.-
 1
1 -
2
-
3
-
4
-
5
-
6
-
7
-
8
-
9
-
10
-
11
-
12
-
13
-
14
-
15
-
16
-
17
-
18
-
19
-
20
-
21
-
22
-
23
-
24
-
25
-
26
-
27
-
28
-
29
-
30
-
31
-
32
-
33
-
34
-
35
-
36
-
37
-
38
-
39
-
40
-
41
-
42
-
43
-
44
-
45
-
46
-
47
-
48
-
49
-
50
-
51
-
52
-
53
-
54
-
55
-
56
-
57
-
58
-
59
-
60
-
61
-
62
-
63
-
64
-
65
-
66
-
67
-
68
-
69
-
70
-
71
-
72
-
73
-
74
-
75
-
76
-
77
-
78
-
79
-
80
-
81
-
82
-
83
-
84
-
85
-
86
-
87
-
88
-
89
-
90
-
91
-
92
-
93
-
94
-
 95
95 -
 96
96 -
 97
97 -
 98
98 -
 99
99 -
 100
100 -
 101
101 -
 102
102 -
 103
103 -
 104
104 -
 105
105 -
 106
106 -
 107
107 -
 108
108 -
 109
109 -
 110
110 -
 111
111 -
 112
112 -
 113
113 -
 114
114 -
 115
115 -
116
-
117
-
118
-
119
-
120
-
121
-
122
-
123
-
124
-
125
-
126
-
127
-
128
-
129
-
130
-
131
-
132
-
133
-
134
-
135
-
136
-
137
-
138
-
139
-
140
-
141
-
142
-
143
-
144
-
145
-
146
-
147
-
148
 |
 |

103
Qantas Annual Report 2006
Notes to the Financial Statements
for the year ended 30 June 2006
Qantas Group Qantas
2006
$M
2005
$M
2006
$M
2005
$M
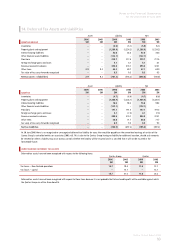
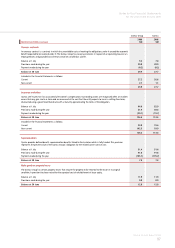
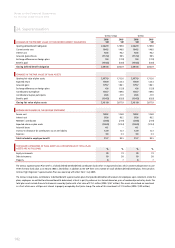
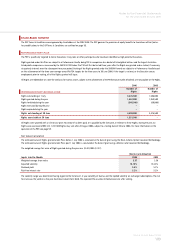
RECONCILIATION TO THE BALANCE SHEETS
Present value of defined benefit obligation 2,041.8 2,042.9 2,041.8 2,042.9
Fair value of plan assets 2,411.0 2,077.9 2,411.0 2,077.9
Surplus (369.2) (35.0) (369.2) (35.0)
Unrecognised actuarial gains 376.5 86.4 376.5 86.4
Recognised liability for defi ned benefi t obligation 7.3 51.4 7.3 51.4
HISTORICAL AMOUNTS
Defined benefit obligation 2,041.8 2,042.9 2,041.8 2,042.9
Plan assets 2,411.0 2,077.9 2,411.0 2,077.9
Surplus 369.2 35.0 369.2 35.0
Experience adjustments on plan liabilities 3.9 (63.6) 3.9 (63.6)
Experience adjustments on plan assets 179.7 180.1 179.7 180.1
PRINCIPAL ACTUARIAL ASSUMPTIONS AT BALANCE DATE
(EXPRESSED AS WEIGHTED AVERAGES)
%%%%
Discount rate 5.8 5.1 5.8 5.1
Expected return on plan assets 7.0 7.2 7.0 7.2
Future salary increases 3.2 3.0 3.2 3.0
The expected long-term rate of return is based on the portfolio as a whole and not on the sum of the returns on individual asset categories. The return is based
exclusively on historical returns, without adjustments.
NET FINANCIAL POSITION
In accordance with AAS 25 Financial Reporting by Superannuation Plans, the plan’s net financial position is determined as the difference between the present
value of the accrued benefi ts and the net market value of plan assets. The net surplus determined in the plan’s most recent actuarial assessment (30 June 2005)
was $139.0 million.
EMPLOYER CONTRIBUTIONS
The objective of funding is to ensure that the benefit entitlements of members and other beneficiaries are fully funded by the time they become payable. To
achieve this objective, the actuary has adopted a method of funding benefits known as the aggregate funding method. This funding method seeks to have
benefits funded by means of a total contribution which is expected to be a constant percentage of members’ salaries over their working lifetimes.
Using the funding method described above, and particular assumptions as to the plan’s future experience (as detailed below), the actuary recommended in the
actuarial review as at 30 June 2005, the payment of employer contributions to the plan of 13.0 per cent of salaries for all employees including members of the
defined benefit section.
The Qantas Group expects to contribute 13.0 per cent to its superannuation plans in the 2007 financial year.
The economic assumptions used by the actuary to make the funding recommendations were a long-term investment earning rate of 7.0 per cent per annum
and a salary increase rate of 3.2 per cent per annum.