Qantas 2006 Annual Report Download - page 84
Download and view the complete annual report
Please find page 84 of the 2006 Qantas annual report below. You can navigate through the pages in the report by either clicking on the pages listed below, or by using the keyword search tool below to find specific information within the annual report.-
 1
1 -
2
-
3
-
4
-
5
-
6
-
7
-
8
-
9
-
10
-
11
-
12
-
13
-
14
-
15
-
16
-
17
-
18
-
19
-
20
-
21
-
22
-
23
-
24
-
25
-
26
-
27
-
28
-
29
-
30
-
31
-
32
-
33
-
34
-
35
-
36
-
37
-
38
-
39
-
40
-
41
-
42
-
43
-
44
-
45
-
46
-
47
-
48
-
49
-
50
-
51
-
52
-
53
-
54
-
55
-
56
-
57
-
58
-
59
-
60
-
61
-
62
-
63
-
64
-
65
-
66
-
67
-
68
-
69
-
70
-
71
-
72
-
73
-
 74
74 -
 75
75 -
 76
76 -
 77
77 -
 78
78 -
 79
79 -
 80
80 -
 81
81 -
 82
82 -
 83
83 -
 84
84 -
 85
85 -
 86
86 -
 87
87 -
 88
88 -
 89
89 -
 90
90 -
 91
91 -
 92
92 -
 93
93 -
 94
94 -
95
-
96
-
97
-
98
-
99
-
100
-
101
-
102
-
103
-
104
-
105
-
106
-
107
-
108
-
109
-
110
-
111
-
112
-
113
-
114
-
115
-
116
-
117
-
118
-
119
-
120
-
121
-
122
-
123
-
124
-
125
-
126
-
127
-
128
-
129
-
130
-
131
-
132
-
133
-
134
-
135
-
136
-
137
-
138
-
139
-
140
-
141
-
142
-
143
-
144
-
145
-
146
-
147
-
148
 |
 |

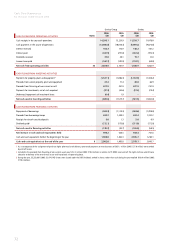
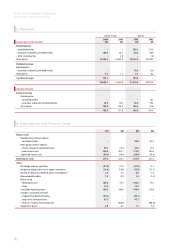
82
Notes to the Financial Statements
for the year ended 30 June 2006
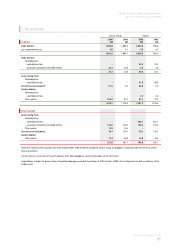
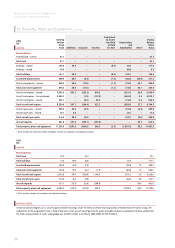
2. Revenue
Qantas Group Qantas
2006
$M
2005
$M
2006
$M
2005
$M
SALES AND OTHER INCOME
Related parties
– controlled entities ––233.1 123.3
– associates and jointly controlled entities 183.6 92.7 44.5 88.9
– other related parties – 2.8 – 2.8
Other parties 13,355.4 12,467.2 10,912.9 10,189.4
Dividend revenue
Related parties
– associates and jointly controlled entities ––18.4 12.6
Other parties 3.3 1.2 1.3 0.2
Liquidated damages 104.4 –104.4 –
13,646.7 12,563.9 11,314.6 10,417.2
FINANCE INCOME
Interest revenue
Related parties
– controlled entities ––– 0.1
– associates and jointly controlled entities 10.3 10.3 10.3 10.3
Other parties 153.0 106.7 136.3 91.0
163.3 117.0 146.6 101.4
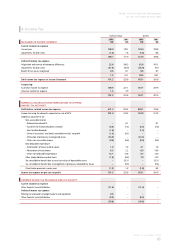
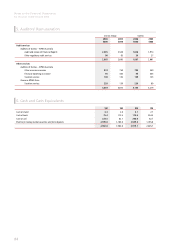
3. Expenditure and Finance Costs
$M $M $M $M
Finance costs
Related parties interest expense
– controlled entities ––80.3 84.1
Other parties interest expense
– finance charges on capitalised leases 39.7 23.4 37.9 24.2
– other finance costs 246.6 267.7 177.8 187.6
Capitalised finance costs (68.4) (74.4) (68.4) (74.4)
Total fi nance costs 217.9 216.7 227.6 221.5
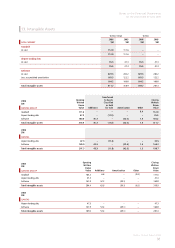
Other
Net foreign currency (gain)/loss (57.8) 21.8 (57.3) 11.7
Net gain on disposal of aircraft, engines and spares (16.4) (13.0) (15.9) (12.2)
Net loss on disposal of property, plant and equipment 2.5 3.4 4.8 2.4
Bad and doubtful debts 1.9 (1.1) 1.6 (1.4)
Restructuring
– Redundancy costs 108.6 19.1 104.6 19.1
– Other 72.9 –72.9 –
Cancellable operating leases 163.2 149.0 149.0 128.0
Change in accounting estimates
– Frequent Flyer deferred revenue (49.1) –(49.1) –
– long service leave provisions 47.7 –47.7 –
– reversal of surplus revenue provision – (52.1) – (52.1)
Government grants 6.0 8.2 1.7 3.3