Logitech 2014 Annual Report Download - page 290
Download and view the complete annual report
Please find page 290 of the 2014 Logitech annual report below. You can navigate through the pages in the report by either clicking on the pages listed below, or by using the keyword search tool below to find specific information within the annual report.-
 1
1 -
2
-
3
-
4
-
5
-
6
-
7
-
8
-
9
-
10
-
11
-
12
-
13
-
14
-
15
-
16
-
17
-
18
-
19
-
20
-
21
-
22
-
23
-
24
-
25
-
26
-
27
-
28
-
29
-
30
-
31
-
32
-
33
-
34
-
35
-
36
-
37
-
38
-
39
-
40
-
41
-
42
-
43
-
44
-
45
-
46
-
47
-
48
-
49
-
50
-
51
-
52
-
53
-
54
-
55
-
56
-
57
-
58
-
59
-
60
-
61
-
62
-
63
-
64
-
65
-
66
-
67
-
68
-
69
-
70
-
71
-
72
-
73
-
74
-
75
-
76
-
77
-
78
-
79
-
80
-
81
-
82
-
83
-
84
-
85
-
86
-
87
-
88
-
89
-
90
-
91
-
92
-
93
-
94
-
95
-
96
-
97
-
98
-
99
-
100
-
101
-
102
-
103
-
104
-
105
-
106
-
107
-
108
-
109
-
110
-
111
-
112
-
113
-
114
-
115
-
116
-
117
-
118
-
119
-
120
-
121
-
122
-
123
-
124
-
125
-
126
-
127
-
128
-
129
-
130
-
131
-
132
-
133
-
134
-
135
-
136
-
137
-
138
-
139
-
140
-
141
-
142
-
143
-
144
-
145
-
146
-
147
-
148
-
149
-
150
-
151
-
152
-
153
-
154
-
155
-
156
-
157
-
158
-
159
-
160
-
161
-
162
-
163
-
164
-
165
-
166
-
167
-
168
-
169
-
170
-
171
-
172
-
173
-
174
-
175
-
176
-
177
-
178
-
179
-
180
-
181
-
182
-
183
-
184
-
185
-
186
-
187
-
188
-
189
-
190
-
191
-
192
-
193
-
194
-
195
-
196
-
197
-
198
-
199
-
200
-
201
-
202
-
203
-
204
-
205
-
206
-
207
-
208
-
209
-
210
-
211
-
212
-
213
-
214
-
215
-
216
-
217
-
218
-
219
-
220
-
221
-
222
-
223
-
224
-
225
-
226
-
227
-
228
-
229
-
230
-
231
-
232
-
233
-
234
-
235
-
236
-
237
-
238
-
239
-
240
-
241
-
242
-
243
-
244
-
245
-
246
-
247
-
248
-
249
-
250
-
251
-
252
-
253
-
254
-
255
-
256
-
257
-
258
-
259
-
260
-
261
-
262
-
263
-
264
-
265
-
266
-
267
-
268
-
269
-
270
-
271
-
272
-
273
-
274
-
275
-
276
-
277
-
278
-
279
-
 280
280 -
 281
281 -
 282
282 -
 283
283 -
 284
284 -
 285
285 -
 286
286 -
 287
287 -
 288
288 -
 289
289 -
 290
290 -
 291
291 -
 292
292 -
 293
293 -
 294
294 -
 295
295 -
 296
296 -
 297
297 -
 298
298 -
 299
299 -
 300
300 -
301
-
302
-
303
-
304
-
305
-
306
-
307
-
308
 |
 |

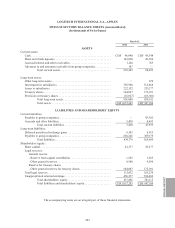
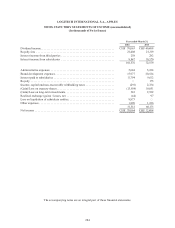
LOGITECH INTERNATIONAL S.A.
NOTES TO CONSOLIDATED FINANCIAL STATEMENTS (Continued)
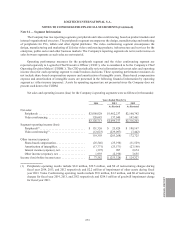
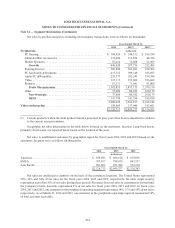
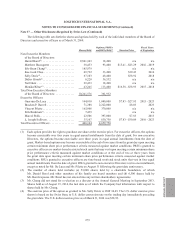
Net sales by product categories, excluding intercompany transactions, were as follows (in thousands):
Years Ended March 31,
2014 2013(1) 2012(1)
Peripherals: As Revised
PC Gaming. . . . . . . . . . . . . . . . . . . . . . . . . . . . . . . . . . . . . . . . . . . . $ 186,926 $ 144,512 $ 186,190
Tablet & Other Accessories . . . . . . . . . . . . . . . . . . . . . . . . . . . . . . . 172,484 119,856 44,326
Mobile Speakers. . . . . . . . . . . . . . . . . . . . . . . . . . . . . . . . . . . . . . . . 87,414 33,408 21,969
Growth: . . . . . . . . . . . . . . . . . . . . . . . . . . . . . . . . . . . . . . . . . . . 446,824 297,776 252,485
Pointing Devices . . . . . . . . . . . . . . . . . . . . . . . . . . . . . . . . . . . . . . . 506,884 521,083 559,366
PC Keyboards & Desktops . . . . . . . . . . . . . . . . . . . . . . . . . . . . . . . 415,512 399,144 383,697
Audio-PC &Wearables. . . . . . . . . . . . . . . . . . . . . . . . . . . . . . . . . . . 255,573 292,245 339,394
Video . . . . . . . . . . . . . . . . . . . . . . . . . . . . . . . . . . . . . . . . . . . . . . . . 137,115 153,060 196,662
Remotes . . . . . . . . . . . . . . . . . . . . . . . . . . . . . . . . . . . . . . . . . . . . . . 67,371 71,641 91,000
Profit Maximization: . . . . . . . . . . . . . . . . . . . . . . . . . . . . . . . . 1,382,455 1,437,173 1,570,119
Other. . . . . . . . . . . . . . . . . . . . . . . . . . . . . . . . . . . . . . . . . . . . . . . . . 37,000 86,102 160,179
Non-Strategic:. . . . . . . . . . . . . . . . . . . . . . . . . . . . . . . . . . . . . . 37,000 86,102 160,179
OEM. . . . . . . . . . . . . . . . . . . . . . . . . . . . . . . . . . . . . . . . . . . . . . 141,749 141,186 185,959
2,008,028 1,962,237 2,168,742
Video conferencing . . . . . . . . . . . . . . . . . . . . . . . . . . . . . . . . . . . . . . . 120,685 137,040 147,461
$2,128,713 $2,099,277 $2,316,203
(1) Certain products within the retail product families presented in prior years have been reclassified to conform
to the current year presentation.
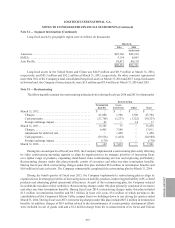
Geographic net sales information in the table below is based on the customers’ location. Long-lived assets,
primarily fixed assets, are reported below based on the location of the asset.
Net sales to unaffiliated customers by geographic region for fiscal years 2014, 2013 and 2012 (based on the
customers’ location) were as follows (in thousands):
Years Ended March 31,
2014 2013 2012
As Revised
Americas . . . . . . . . . . . . . . . . . . . . . . . . . . . . . . . . . . . . . . . $ 859,893 $ 808,618 $ 879,076
EMEA . . . . . . . . . . . . . . . . . . . . . . . . . . . . . . . . . . . . . . . . . 767,017 799,075 897,557
Asia Pacific . . . . . . . . . . . . . . . . . . . . . . . . . . . . . . . . . . . . . 501,803 491,584 539,570
$2,128,713 $2,099,277 $2,316,203
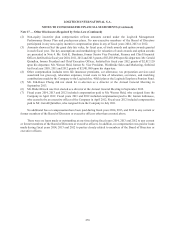
Net sales are attributed to countries on the basis of the customers’ locations. The United States represented
35%, 33% and 34% of net sales for the fiscal years 2014, 2013 and 2012, respectively. No other single country
represented more than 10% of net sales during these periods. Revenues from net sales to customers in Switzerland,
the Company’s home domicile, represented 2% of net sales for fiscal years 2014, 2013 and 2012. In fiscal years
2014, 2013 and 2012, one customer in the peripherals operating segment represented 14%, 11% and 14% of net sales,
respectively. As of March 31, 2014 and 2013, one customer in the peripherals operating segment represented 14%
of total accounts receivable.
Note 14 — Segment Information (Continued)
274