Logitech 2014 Annual Report Download - page 219
Download and view the complete annual report
Please find page 219 of the 2014 Logitech annual report below. You can navigate through the pages in the report by either clicking on the pages listed below, or by using the keyword search tool below to find specific information within the annual report.-
 1
1 -
2
-
3
-
4
-
5
-
6
-
7
-
8
-
9
-
10
-
11
-
12
-
13
-
14
-
15
-
16
-
17
-
18
-
19
-
20
-
21
-
22
-
23
-
24
-
25
-
26
-
27
-
28
-
29
-
30
-
31
-
32
-
33
-
34
-
35
-
36
-
37
-
38
-
39
-
40
-
41
-
42
-
43
-
44
-
45
-
46
-
47
-
48
-
49
-
50
-
51
-
52
-
53
-
54
-
55
-
56
-
57
-
58
-
59
-
60
-
61
-
62
-
63
-
64
-
65
-
66
-
67
-
68
-
69
-
70
-
71
-
72
-
73
-
74
-
75
-
76
-
77
-
78
-
79
-
80
-
81
-
82
-
83
-
84
-
85
-
86
-
87
-
88
-
89
-
90
-
91
-
92
-
93
-
94
-
95
-
96
-
97
-
98
-
99
-
100
-
101
-
102
-
103
-
104
-
105
-
106
-
107
-
108
-
109
-
110
-
111
-
112
-
113
-
114
-
115
-
116
-
117
-
118
-
119
-
120
-
121
-
122
-
123
-
124
-
125
-
126
-
127
-
128
-
129
-
130
-
131
-
132
-
133
-
134
-
135
-
136
-
137
-
138
-
139
-
140
-
141
-
142
-
143
-
144
-
145
-
146
-
147
-
148
-
149
-
150
-
151
-
152
-
153
-
154
-
155
-
156
-
157
-
158
-
159
-
160
-
161
-
162
-
163
-
164
-
165
-
166
-
167
-
168
-
169
-
170
-
171
-
172
-
173
-
174
-
175
-
176
-
177
-
178
-
179
-
180
-
181
-
182
-
183
-
184
-
185
-
186
-
187
-
188
-
189
-
190
-
191
-
192
-
193
-
194
-
195
-
196
-
197
-
198
-
199
-
200
-
201
-
202
-
203
-
204
-
205
-
206
-
207
-
208
-
 209
209 -
 210
210 -
 211
211 -
 212
212 -
 213
213 -
 214
214 -
 215
215 -
 216
216 -
 217
217 -
 218
218 -
 219
219 -
 220
220 -
 221
221 -
 222
222 -
 223
223 -
 224
224 -
 225
225 -
 226
226 -
 227
227 -
 228
228 -
 229
229 -
230
-
231
-
232
-
233
-
234
-
235
-
236
-
237
-
238
-
239
-
240
-
241
-
242
-
243
-
244
-
245
-
246
-
247
-
248
-
249
-
250
-
251
-
252
-
253
-
254
-
255
-
256
-
257
-
258
-
259
-
260
-
261
-
262
-
263
-
264
-
265
-
266
-
267
-
268
-
269
-
270
-
271
-
272
-
273
-
274
-
275
-
276
-
277
-
278
-
279
-
280
-
281
-
282
-
283
-
284
-
285
-
286
-
287
-
288
-
289
-
290
-
291
-
292
-
293
-
294
-
295
-
296
-
297
-
298
-
299
-
300
-
301
-
302
-
303
-
304
-
305
-
306
-
307
-
308
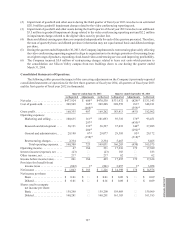
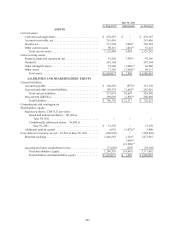
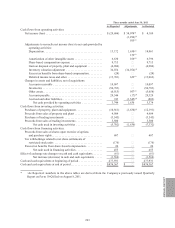
 |
 |

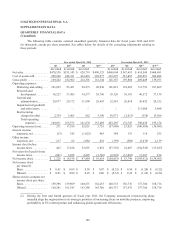
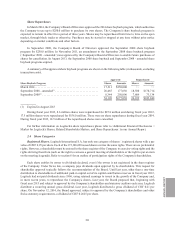
Three months ended June 30, 2011
As Reported Adjustments As Restated
Cash flows from operating activities:
Net income (loss) . . . . . . . . . . . . . . . . . . . . . . . . . . . . . . . . . . . . . . . $ (29,606) $ 34,074(1) $ 4,109
(1,294)(3)
935(4)
Adjustments to reconcile net income (loss) to net cash provided by
operating activities:
Depreciation . . . . . . . . . . . . . . . . . . . . . . . . . . . . . . . . . . . . . . . . 13,172 1,630(2) 14,961
159(4)
Amortization of other intangible assets . . . . . . . . . . . . . . . . . . . 6,630 166(4) 6,796
Share-based compensation expense . . . . . . . . . . . . . . . . . . . . . . 9,715 — 9,715
Gain on disposal of property, plant and equipment . . . . . . . . . . (4,904) — (4,904)
Inventory valuation adjustment . . . . . . . . . . . . . . . . . . . . . . . . . 34,074 (34,074)(1) —
Excess tax benefits from share-based compensation . . . . . . . . . (24) — (24)
Deferred income taxes and other . . . . . . . . . . . . . . . . . . . . . . . . (13,701) 639(4) (13,062)
Changes in assets and liabilities, net of acquisitions:
Accounts receivable . . . . . . . . . . . . . . . . . . . . . . . . . . . . . . . . . . 19,097 — 19,097
Inventories . . . . . . . . . . . . . . . . . . . . . . . . . . . . . . . . . . . . . . . . . (54,783) — (54,783)
Other assets. . . . . . . . . . . . . . . . . . . . . . . . . . . . . . . . . . . . . . . . . (6,015) 957(4) (5,058)
Accounts payable . . . . . . . . . . . . . . . . . . . . . . . . . . . . . . . . . . . . 29,346 (17)(4) 29,329
Accrued and other liabilities. . . . . . . . . . . . . . . . . . . . . . . . . . . . 743 (1,545)(4) (802)
Net cash provided by operating activities . . . . . . . . . . . . . . 3,744 1,630 5,374
Cash flows from investing activities:
Purchases of property, plant and equipment . . . . . . . . . . . . . . . . . . (10,561) (1,630)(2) (12,191)
Proceeds from sales of property and plant . . . . . . . . . . . . . . . . . . . 4,904 — 4,904
Purchases of trading investments . . . . . . . . . . . . . . . . . . . . . . . . . . (3,545) — (3,545)
Proceeds from sales of trading investments . . . . . . . . . . . . . . . . . . 3,500 — 3,500
Net cash used in investing activities . . . . . . . . . . . . . . . . . . (5,702) (1,630) (7,332)
Cash flows from financing activities:
Proceeds from sales of shares upon exercise of options
and purchase rights. . . . . . . . . . . . . . . . . . . . . . . . . . . . . . . . . . . 607 — 607
Tax withholdings related to net share settlements of
restricted stock units . . . . . . . . . . . . . . . . . . . . . . . . . . . . . . . . . (176) — (176)
Excess tax benefits from share-based compensation . . . . . . . . . . . 24 — 24
Net cash used in financing activities . . . . . . . . . . . . . . . . . . 455 — 455
Effect of exchange rate changes on cash and cash equivalents. . . . . . . (61) — (61)
Net increase (decrease) in cash and cash equivalents . . . . . (1,564) — (1,564)
Cash and cash equivalents at beginning of period . . . . . . . . . . . . . . . . 477,931 — 477,931
Cash and cash equivalents at end of period. . . . . . . . . . . . . . . . . . . . . . $ 476,367 $ — $ 476,367
* “As Reported” numbers in the above tables are derived from the Company’s previously issued Quarterly
Report on Form 10-Q filed on August 8, 2011.
ANNUAl REPORT
203