Logitech 2014 Annual Report Download - page 205
Download and view the complete annual report
Please find page 205 of the 2014 Logitech annual report below. You can navigate through the pages in the report by either clicking on the pages listed below, or by using the keyword search tool below to find specific information within the annual report.-
 1
1 -
2
-
3
-
4
-
5
-
6
-
7
-
8
-
9
-
10
-
11
-
12
-
13
-
14
-
15
-
16
-
17
-
18
-
19
-
20
-
21
-
22
-
23
-
24
-
25
-
26
-
27
-
28
-
29
-
30
-
31
-
32
-
33
-
34
-
35
-
36
-
37
-
38
-
39
-
40
-
41
-
42
-
43
-
44
-
45
-
46
-
47
-
48
-
49
-
50
-
51
-
52
-
53
-
54
-
55
-
56
-
57
-
58
-
59
-
60
-
61
-
62
-
63
-
64
-
65
-
66
-
67
-
68
-
69
-
70
-
71
-
72
-
73
-
74
-
75
-
76
-
77
-
78
-
79
-
80
-
81
-
82
-
83
-
84
-
85
-
86
-
87
-
88
-
89
-
90
-
91
-
92
-
93
-
94
-
95
-
96
-
97
-
98
-
99
-
100
-
101
-
102
-
103
-
104
-
105
-
106
-
107
-
108
-
109
-
110
-
111
-
112
-
113
-
114
-
115
-
116
-
117
-
118
-
119
-
120
-
121
-
122
-
123
-
124
-
125
-
126
-
127
-
128
-
129
-
130
-
131
-
132
-
133
-
134
-
135
-
136
-
137
-
138
-
139
-
140
-
141
-
142
-
143
-
144
-
145
-
146
-
147
-
148
-
149
-
150
-
151
-
152
-
153
-
154
-
155
-
156
-
157
-
158
-
159
-
160
-
161
-
162
-
163
-
164
-
165
-
166
-
167
-
168
-
169
-
170
-
171
-
172
-
173
-
174
-
175
-
176
-
177
-
178
-
179
-
180
-
181
-
182
-
183
-
184
-
185
-
186
-
187
-
188
-
189
-
190
-
191
-
192
-
193
-
194
-
 195
195 -
 196
196 -
 197
197 -
 198
198 -
 199
199 -
 200
200 -
 201
201 -
 202
202 -
 203
203 -
 204
204 -
 205
205 -
 206
206 -
 207
207 -
 208
208 -
 209
209 -
 210
210 -
 211
211 -
 212
212 -
 213
213 -
 214
214 -
 215
215 -
216
-
217
-
218
-
219
-
220
-
221
-
222
-
223
-
224
-
225
-
226
-
227
-
228
-
229
-
230
-
231
-
232
-
233
-
234
-
235
-
236
-
237
-
238
-
239
-
240
-
241
-
242
-
243
-
244
-
245
-
246
-
247
-
248
-
249
-
250
-
251
-
252
-
253
-
254
-
255
-
256
-
257
-
258
-
259
-
260
-
261
-
262
-
263
-
264
-
265
-
266
-
267
-
268
-
269
-
270
-
271
-
272
-
273
-
274
-
275
-
276
-
277
-
278
-
279
-
280
-
281
-
282
-
283
-
284
-
285
-
286
-
287
-
288
-
289
-
290
-
291
-
292
-
293
-
294
-
295
-
296
-
297
-
298
-
299
-
300
-
301
-
302
-
303
-
304
-
305
-
306
-
307
-
308
 |
 |

In September 2012, the Company’s shareholders approved the cancellation of the 18.5 million shares
repurchased under the September 2008 amended share buyback program. These shares were legally cancelled in
during the quarter ended December 31, 2013.
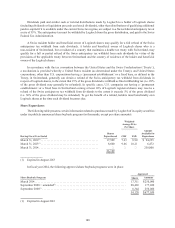
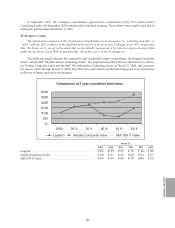
Performance Graph
The information contained in the Performance Graph shall not be deemed to be “soliciting material” or
“ filed” with the SEC or subject to the liabilities of Section 18 of the Securities Exchange Act of 1934, as amended
(the “Exchange Act”), except to the extent that we specifically incorporate it by reference into a document filed
under the Securities Act of 1933, as amended (the “Securities Act”), or the Exchange Act.
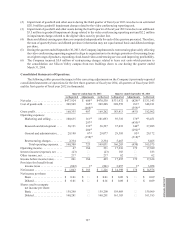
The following graph compares the cumulative total stockholder return on our shares, the Nasdaq Composite
Index, and the S&P 500 Information Technology Index. The graph assumes that $100 was invested in our shares,
the Nasdaq Composite Index and the S&P 500 Information Technology Index on March 31, 2009, and calculates
the annual return through March 31, 2014. The stock price performance on the following graph is not necessarily
indicative of future stock price performance.
Logitech Nasdaq Composite Index S&P 500 Index
Logitech Nasdaq Composite Index S&P 500 IT Index
Comparison of 5 year cumulative total return
2009 2010 2011 2012 2013 2014
$-
$50
$100
$150
$200
$250
$300
March 31,
2009 2010 2011 2012 2013 2014
Logitech .......................................... $100 $159 $176 $ 76 $ 68 $145
Nasdaq Composite Index ............................. $100 $157 $182 $202 $214 $275
S&P 500 IT Index ................................... $100 $146 $166 $176 $200 $235
ANNUAl REPORT
189