Logitech 2014 Annual Report Download - page 194
Download and view the complete annual report
Please find page 194 of the 2014 Logitech annual report below. You can navigate through the pages in the report by either clicking on the pages listed below, or by using the keyword search tool below to find specific information within the annual report.-
 1
1 -
2
-
3
-
4
-
5
-
6
-
7
-
8
-
9
-
10
-
11
-
12
-
13
-
14
-
15
-
16
-
17
-
18
-
19
-
20
-
21
-
22
-
23
-
24
-
25
-
26
-
27
-
28
-
29
-
30
-
31
-
32
-
33
-
34
-
35
-
36
-
37
-
38
-
39
-
40
-
41
-
42
-
43
-
44
-
45
-
46
-
47
-
48
-
49
-
50
-
51
-
52
-
53
-
54
-
55
-
56
-
57
-
58
-
59
-
60
-
61
-
62
-
63
-
64
-
65
-
66
-
67
-
68
-
69
-
70
-
71
-
72
-
73
-
74
-
75
-
76
-
77
-
78
-
79
-
80
-
81
-
82
-
83
-
84
-
85
-
86
-
87
-
88
-
89
-
90
-
91
-
92
-
93
-
94
-
95
-
96
-
97
-
98
-
99
-
100
-
101
-
102
-
103
-
104
-
105
-
106
-
107
-
108
-
109
-
110
-
111
-
112
-
113
-
114
-
115
-
116
-
117
-
118
-
119
-
120
-
121
-
122
-
123
-
124
-
125
-
126
-
127
-
128
-
129
-
130
-
131
-
132
-
133
-
134
-
135
-
136
-
137
-
138
-
139
-
140
-
141
-
142
-
143
-
144
-
145
-
146
-
147
-
148
-
149
-
150
-
151
-
152
-
153
-
154
-
155
-
156
-
157
-
158
-
159
-
160
-
161
-
162
-
163
-
164
-
165
-
166
-
167
-
168
-
169
-
170
-
171
-
172
-
173
-
174
-
175
-
176
-
177
-
178
-
179
-
180
-
181
-
182
-
183
-
 184
184 -
 185
185 -
 186
186 -
 187
187 -
 188
188 -
 189
189 -
 190
190 -
 191
191 -
 192
192 -
 193
193 -
 194
194 -
 195
195 -
 196
196 -
 197
197 -
 198
198 -
 199
199 -
 200
200 -
 201
201 -
 202
202 -
 203
203 -
 204
204 -
205
-
206
-
207
-
208
-
209
-
210
-
211
-
212
-
213
-
214
-
215
-
216
-
217
-
218
-
219
-
220
-
221
-
222
-
223
-
224
-
225
-
226
-
227
-
228
-
229
-
230
-
231
-
232
-
233
-
234
-
235
-
236
-
237
-
238
-
239
-
240
-
241
-
242
-
243
-
244
-
245
-
246
-
247
-
248
-
249
-
250
-
251
-
252
-
253
-
254
-
255
-
256
-
257
-
258
-
259
-
260
-
261
-
262
-
263
-
264
-
265
-
266
-
267
-
268
-
269
-
270
-
271
-
272
-
273
-
274
-
275
-
276
-
277
-
278
-
279
-
280
-
281
-
282
-
283
-
284
-
285
-
286
-
287
-
288
-
289
-
290
-
291
-
292
-
293
-
294
-
295
-
296
-
297
-
298
-
299
-
300
-
301
-
302
-
303
-
304
-
305
-
306
-
307
-
308
 |
 |

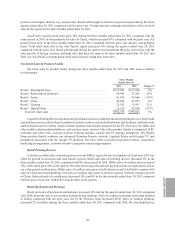
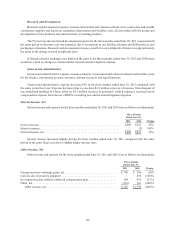
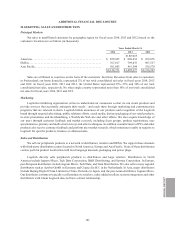
Research and Development
Research and development expense consists of personnel and related overhead costs, contractors and outside
consultants, supplies and materials, equipment depreciation and facilities costs, all associated with the design and
development of new products and enhancements of existing products.
The 5% increase in research and development expense for the three months ended June 30, 2011 compared with
the same period in the prior year was primarily due to investment in our LifeSize division and B2B products, and
packaging evaluations. Research and development expense growth for our peripherals division was approximately
the same as the change in retail peripherals sales.
If foreign currency exchange rates had been the same in the three months ended June 30, 2011 and 2010, there
would have been no change in constant dollar research and development expense.
General and Administrative
General and administrative expense consists primarily of personnel and related overhead and facilities costs
for the finance, information systems, executive, human resources and legal functions.
General and administrative expense decreased 4% in the three months ended June 30, 2011 compared with
the same period last year. Expense decreased due to one-time $4.9 million recovery of expense from disposal of
one abandoned building in China, offset by $2.1 million increase in personnel- related expenses, increased stock
compensation expense from the use of RSUs, recruiting fees and increased litigation expenses.
Interest Income, Net
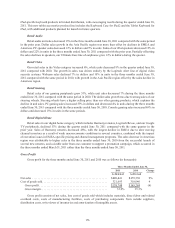
Interest income and expense for the three months ended June 30, 2011 and 2010 were as follows (in thousands):
Three Months
Ended June 30,
2011 2010 Change
Interest income ........................................................ $690 $523 32%
Interest expense ........................................................ — (2) 100%
Interest income, net ..................................................... $690 $521 32%
Interest income increased slightly during the three months ended June 30, 2011 compared with the same
period in the prior fiscal year due to slightly higher interest rates.
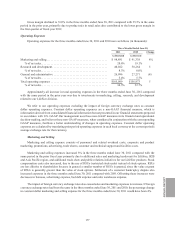
Other Income, Net
Other income and expense for the three months ended June 30, 2011 and 2010 were as follows (in thousands):
Three Months
Ended June 30,
2011 2010 Change
Foreign currency exchange gains, net .................................... $ 340 $ 360 (6)%
Gain on sale of property and plant ...................................... — 838 (100)%
Investment income related to deferred compensation plan.................... 188 435 (57)%
Other, net .......................................................... (241) 163 (248)%
Other income, net................................................. $ 287 $1,796 (840)%
178