Logitech 2014 Annual Report Download - page 173
Download and view the complete annual report
Please find page 173 of the 2014 Logitech annual report below. You can navigate through the pages in the report by either clicking on the pages listed below, or by using the keyword search tool below to find specific information within the annual report.-
 1
1 -
2
-
3
-
4
-
5
-
6
-
7
-
8
-
9
-
10
-
11
-
12
-
13
-
14
-
15
-
16
-
17
-
18
-
19
-
20
-
21
-
22
-
23
-
24
-
25
-
26
-
27
-
28
-
29
-
30
-
31
-
32
-
33
-
34
-
35
-
36
-
37
-
38
-
39
-
40
-
41
-
42
-
43
-
44
-
45
-
46
-
47
-
48
-
49
-
50
-
51
-
52
-
53
-
54
-
55
-
56
-
57
-
58
-
59
-
60
-
61
-
62
-
63
-
64
-
65
-
66
-
67
-
68
-
69
-
70
-
71
-
72
-
73
-
74
-
75
-
76
-
77
-
78
-
79
-
80
-
81
-
82
-
83
-
84
-
85
-
86
-
87
-
88
-
89
-
90
-
91
-
92
-
93
-
94
-
95
-
96
-
97
-
98
-
99
-
100
-
101
-
102
-
103
-
104
-
105
-
106
-
107
-
108
-
109
-
110
-
111
-
112
-
113
-
114
-
115
-
116
-
117
-
118
-
119
-
120
-
121
-
122
-
123
-
124
-
125
-
126
-
127
-
128
-
129
-
130
-
131
-
132
-
133
-
134
-
135
-
136
-
137
-
138
-
139
-
140
-
141
-
142
-
143
-
144
-
145
-
146
-
147
-
148
-
149
-
150
-
151
-
152
-
153
-
154
-
155
-
156
-
157
-
158
-
159
-
160
-
161
-
162
-
 163
163 -
 164
164 -
 165
165 -
 166
166 -
 167
167 -
 168
168 -
 169
169 -
 170
170 -
 171
171 -
 172
172 -
 173
173 -
 174
174 -
 175
175 -
 176
176 -
 177
177 -
 178
178 -
 179
179 -
 180
180 -
 181
181 -
 182
182 -
 183
183 -
184
-
185
-
186
-
187
-
188
-
189
-
190
-
191
-
192
-
193
-
194
-
195
-
196
-
197
-
198
-
199
-
200
-
201
-
202
-
203
-
204
-
205
-
206
-
207
-
208
-
209
-
210
-
211
-
212
-
213
-
214
-
215
-
216
-
217
-
218
-
219
-
220
-
221
-
222
-
223
-
224
-
225
-
226
-
227
-
228
-
229
-
230
-
231
-
232
-
233
-
234
-
235
-
236
-
237
-
238
-
239
-
240
-
241
-
242
-
243
-
244
-
245
-
246
-
247
-
248
-
249
-
250
-
251
-
252
-
253
-
254
-
255
-
256
-
257
-
258
-
259
-
260
-
261
-
262
-
263
-
264
-
265
-
266
-
267
-
268
-
269
-
270
-
271
-
272
-
273
-
274
-
275
-
276
-
277
-
278
-
279
-
280
-
281
-
282
-
283
-
284
-
285
-
286
-
287
-
288
-
289
-
290
-
291
-
292
-
293
-
294
-
295
-
296
-
297
-
298
-
299
-
300
-
301
-
302
-
303
-
304
-
305
-
306
-
307
-
308
 |
 |

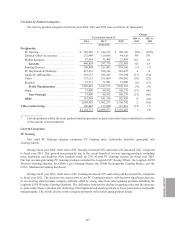
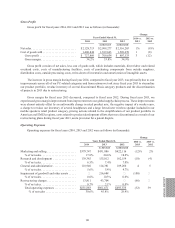
Net Sales by Product Categories
Net sales by product categories for fiscal years 2014, 2013 and 2012 were as follows (in thousands):
Years Ended March 31,
Change
2014 vs.
2013
2013 vs.
20122014 2013* 2012*
As Revised
Peripherals:
PC Gaming......................... $ 186,926 $ 144,512 $ 186,190 29% (22)%
Tablet & Other Accessories ............ 172,484 119,856 44,326 44 170
Mobile Speakers..................... 87,414 33,408 21,969 162 52
Growth......................... 446,824 297,776 252,485 50 18
Pointing Devices .................... 506,884 521,083 559,366 (3) (7)
PC Keyboards & Desktops ............ 415,512 399,144 383,697 4 4
Audio-PC &Wearables................ 255,573 292,245 339,394 (13) (14)
Video ............................. 137,115 153,060 196,662 (10) (22)
Remotes ........................... 67,371 71,641 91,000 (6) (21)
Profit Maximization.............. 1,382,455 1,437,173 1,570,119 (4) (8)
Other.............................. 37,000 86,102 160,179 (57) (46)
Non-Strategic ................... 37,000 86,102 160,179 (57) (46)
OEM ............................. 141,749 141,186 185,959 0 (24)
2,008,028 1,962,237 2,168,742 2 (10)
Video conferencing .................... 120,685 137,040 147,461 (12) (7)
$2,128,713 $2,099,277 $2,316,203 1 (9)
* Certain products within the retail product families presented in prior years have been reclassified to conform
to the current year presentation.
Growth Categories:
PC Gaming
Our retail PC Gaming category comprises PC Gaming mice, keyboards, headsets, gamepads and
steering wheels.
During fiscal year 2014, retail sales of PC Gaming increased 29% and units sold increased 24%, compared
to fiscal year 2013. This growth was primarily due to the recent launch of our new gaming products, including
mice, keyboards and headsets. New products made up 23% of total PC Gaming revenue for fiscal year 2014.
Our top revenue-generating PC Gaming products included the Logitech G27 Racing Wheel, the Logitech G930
Wireless Gaming Headset, the G500s Laser Gaming Mouse, the G700s Rechargeable Gaming Mouse, and the
G710+ Mechanical Gaming Keyboard.
During fiscal year 2013, retail sales of PC Gaming decreased 22% and units sold decreased 9%, compared
to fiscal year 2012. The decrease was across most of our PC Gaming products, with the most significant decrease
in our steering wheel product category, partially offset by strong sales from select gaming products including the
Logitech G930 Wireless Gaming Headsets. The difference between the decline in gaming sales and the decrease
in units sold reflects a product mix shift away from higher-priced steering wheels to lower-priced mice, keyboards
and gamepads. The overall decline in this category primarily reflected an aging product lineup.
ANNUAl REPORT
157