Logitech 2014 Annual Report Download - page 208
Download and view the complete annual report
Please find page 208 of the 2014 Logitech annual report below. You can navigate through the pages in the report by either clicking on the pages listed below, or by using the keyword search tool below to find specific information within the annual report.-
 1
1 -
2
-
3
-
4
-
5
-
6
-
7
-
8
-
9
-
10
-
11
-
12
-
13
-
14
-
15
-
16
-
17
-
18
-
19
-
20
-
21
-
22
-
23
-
24
-
25
-
26
-
27
-
28
-
29
-
30
-
31
-
32
-
33
-
34
-
35
-
36
-
37
-
38
-
39
-
40
-
41
-
42
-
43
-
44
-
45
-
46
-
47
-
48
-
49
-
50
-
51
-
52
-
53
-
54
-
55
-
56
-
57
-
58
-
59
-
60
-
61
-
62
-
63
-
64
-
65
-
66
-
67
-
68
-
69
-
70
-
71
-
72
-
73
-
74
-
75
-
76
-
77
-
78
-
79
-
80
-
81
-
82
-
83
-
84
-
85
-
86
-
87
-
88
-
89
-
90
-
91
-
92
-
93
-
94
-
95
-
96
-
97
-
98
-
99
-
100
-
101
-
102
-
103
-
104
-
105
-
106
-
107
-
108
-
109
-
110
-
111
-
112
-
113
-
114
-
115
-
116
-
117
-
118
-
119
-
120
-
121
-
122
-
123
-
124
-
125
-
126
-
127
-
128
-
129
-
130
-
131
-
132
-
133
-
134
-
135
-
136
-
137
-
138
-
139
-
140
-
141
-
142
-
143
-
144
-
145
-
146
-
147
-
148
-
149
-
150
-
151
-
152
-
153
-
154
-
155
-
156
-
157
-
158
-
159
-
160
-
161
-
162
-
163
-
164
-
165
-
166
-
167
-
168
-
169
-
170
-
171
-
172
-
173
-
174
-
175
-
176
-
177
-
178
-
179
-
180
-
181
-
182
-
183
-
184
-
185
-
186
-
187
-
188
-
189
-
190
-
191
-
192
-
193
-
194
-
195
-
196
-
197
-
 198
198 -
 199
199 -
 200
200 -
 201
201 -
 202
202 -
 203
203 -
 204
204 -
 205
205 -
 206
206 -
 207
207 -
 208
208 -
 209
209 -
 210
210 -
 211
211 -
 212
212 -
 213
213 -
 214
214 -
 215
215 -
 216
216 -
 217
217 -
 218
218 -
219
-
220
-
221
-
222
-
223
-
224
-
225
-
226
-
227
-
228
-
229
-
230
-
231
-
232
-
233
-
234
-
235
-
236
-
237
-
238
-
239
-
240
-
241
-
242
-
243
-
244
-
245
-
246
-
247
-
248
-
249
-
250
-
251
-
252
-
253
-
254
-
255
-
256
-
257
-
258
-
259
-
260
-
261
-
262
-
263
-
264
-
265
-
266
-
267
-
268
-
269
-
270
-
271
-
272
-
273
-
274
-
275
-
276
-
277
-
278
-
279
-
280
-
281
-
282
-
283
-
284
-
285
-
286
-
287
-
288
-
289
-
290
-
291
-
292
-
293
-
294
-
295
-
296
-
297
-
298
-
299
-
300
-
301
-
302
-
303
-
304
-
305
-
306
-
307
-
308
 |
 |

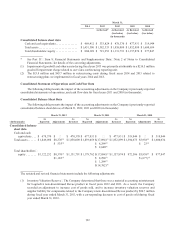
March 31,
2014 2013 2012 2011 2010
As Revised* As Restated As Restated As Revised
(See below) (See below) (See below)
(in thousands)
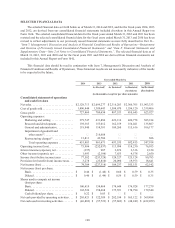
Consolidated balance sheet data
Cash and cash equivalents ............... $ 469,412 $ 333,824 $ 478,370 $ 477,931 $ 319,944
Total assets ........................... $1,451,390 $1,382,333 $1,858,009 $1,852,899 $1,600,634
Total shareholders’ equity ............... $ 804,128 $ 721,953 $1,131,791 $1,157,874 $ 977,847
* See Part II—“Item 8: Financial Statements and Supplementary Data—Note 2 of Notes to Consolidated
Financial Statements” for details of the correcting adjustments.
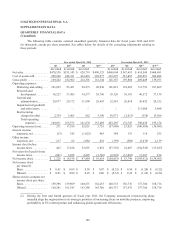
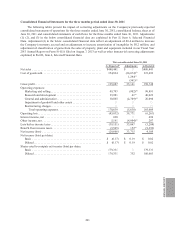
(1) Impairment of goodwill and other assets during fiscal year 2013 was primarily attributable to a $214.5 million
goodwill impairment charge related to our video conferencing reporting unit.
(2) The $13.8 million and $43.7 million in restructuring costs during fiscal years 2014 and 2013 related to
restructuring plans we implemented in fiscal years 2014 and 2013.
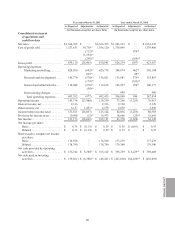
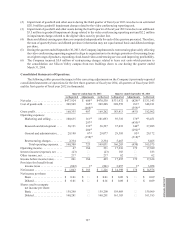
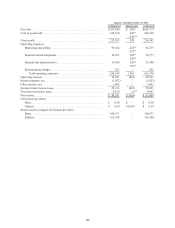
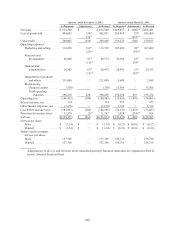
Consolidated Statement of Operations and Cash Flow Data
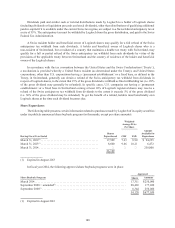
The following table presents the impact of the accounting adjustments on the Company’s previously-reported
consolidated statements of operations, and cash flow data for fiscal years 2011 and 2010 (in thousands):
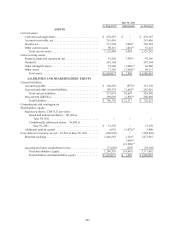
Consolidated Balance Sheet Data
The following table presents the impact of the accounting adjustments on the Company’s previously-reported
consolidated balance sheet data as of March 31, 2012, 2011 and 2010 (in thousands):
March 31, 2012 March 31, 2011 March 31, 2010
(In thousands)
As
Reported Adjustments
As
Restated
As
Reported Adjustments
As
Restated
As
Reported Adjustments
As
Revised
Consolidated balance
sheet data
Cash and cash
equivalents . . . $ 478,370 $ — $ 478,370 $ 477,931 $ — $ 477,931 $ 319,944 $ — $ 319,944
Total assets . . . . . . $ 1,849,098 $8,376(2) $1,858,009 $1,859,059 $(17,094)(1) $1,852,899 $ 1,594,673 $5,938(2) $ 1,600,634
$ 535(4) $ 8,294(2) $ 23(4)
$ 2,640(4)
Total shareholders’
equity . . . . . . . $1,122,232 $8,376(2) $1,131,791 $ 1,179,762 $(17,094)(1) $1,157,874 $ 972,586 $5,938(2) $ 977,847
$1,183(4) $ 8,294(2) $ (677)(4)
$ 1,294(3)
$(14,382)(4)
The restated and revised financial statements include the following adjustments:
(1) Inventory Valuation Reserve—The Company determined that there was a material accounting misstatement
for Logitech’s now-discontinued Revue product in fiscal years 2012 and 2011. As a result, the Company
recorded an adjustment to increase cost of goods sold, and to increase inventory valuation reserves and
supplier liability for components related to the Company’s now discontinued Revue product by $30.7 million
during fiscal year ended March 31, 2011, with a corresponding decrease to cost of goods sold during fiscal
year ended March 31, 2012.
192