Logitech 2014 Annual Report Download - page 193
Download and view the complete annual report
Please find page 193 of the 2014 Logitech annual report below. You can navigate through the pages in the report by either clicking on the pages listed below, or by using the keyword search tool below to find specific information within the annual report.-
 1
1 -
2
-
3
-
4
-
5
-
6
-
7
-
8
-
9
-
10
-
11
-
12
-
13
-
14
-
15
-
16
-
17
-
18
-
19
-
20
-
21
-
22
-
23
-
24
-
25
-
26
-
27
-
28
-
29
-
30
-
31
-
32
-
33
-
34
-
35
-
36
-
37
-
38
-
39
-
40
-
41
-
42
-
43
-
44
-
45
-
46
-
47
-
48
-
49
-
50
-
51
-
52
-
53
-
54
-
55
-
56
-
57
-
58
-
59
-
60
-
61
-
62
-
63
-
64
-
65
-
66
-
67
-
68
-
69
-
70
-
71
-
72
-
73
-
74
-
75
-
76
-
77
-
78
-
79
-
80
-
81
-
82
-
83
-
84
-
85
-
86
-
87
-
88
-
89
-
90
-
91
-
92
-
93
-
94
-
95
-
96
-
97
-
98
-
99
-
100
-
101
-
102
-
103
-
104
-
105
-
106
-
107
-
108
-
109
-
110
-
111
-
112
-
113
-
114
-
115
-
116
-
117
-
118
-
119
-
120
-
121
-
122
-
123
-
124
-
125
-
126
-
127
-
128
-
129
-
130
-
131
-
132
-
133
-
134
-
135
-
136
-
137
-
138
-
139
-
140
-
141
-
142
-
143
-
144
-
145
-
146
-
147
-
148
-
149
-
150
-
151
-
152
-
153
-
154
-
155
-
156
-
157
-
158
-
159
-
160
-
161
-
162
-
163
-
164
-
165
-
166
-
167
-
168
-
169
-
170
-
171
-
172
-
173
-
174
-
175
-
176
-
177
-
178
-
179
-
180
-
181
-
182
-
 183
183 -
 184
184 -
 185
185 -
 186
186 -
 187
187 -
 188
188 -
 189
189 -
 190
190 -
 191
191 -
 192
192 -
 193
193 -
 194
194 -
 195
195 -
 196
196 -
 197
197 -
 198
198 -
 199
199 -
 200
200 -
 201
201 -
 202
202 -
 203
203 -
204
-
205
-
206
-
207
-
208
-
209
-
210
-
211
-
212
-
213
-
214
-
215
-
216
-
217
-
218
-
219
-
220
-
221
-
222
-
223
-
224
-
225
-
226
-
227
-
228
-
229
-
230
-
231
-
232
-
233
-
234
-
235
-
236
-
237
-
238
-
239
-
240
-
241
-
242
-
243
-
244
-
245
-
246
-
247
-
248
-
249
-
250
-
251
-
252
-
253
-
254
-
255
-
256
-
257
-
258
-
259
-
260
-
261
-
262
-
263
-
264
-
265
-
266
-
267
-
268
-
269
-
270
-
271
-
272
-
273
-
274
-
275
-
276
-
277
-
278
-
279
-
280
-
281
-
282
-
283
-
284
-
285
-
286
-
287
-
288
-
289
-
290
-
291
-
292
-
293
-
294
-
295
-
296
-
297
-
298
-
299
-
300
-
301
-
302
-
303
-
304
-
305
-
306
-
307
-
308
 |
 |

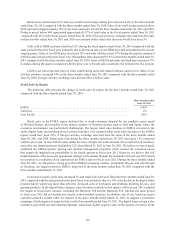
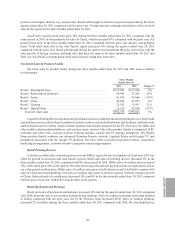
Gross margin declined to 33.0% in the three months ended June 30, 2011 compared with 35.3% in the same
period in the prior year, primarily due to product mix in retail sales also contributed to the lower gross margin in
the first quarter of fiscal year 2012.
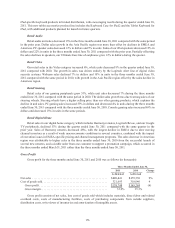
Operating Expenses
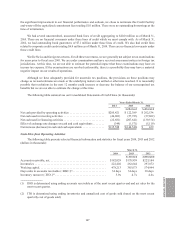
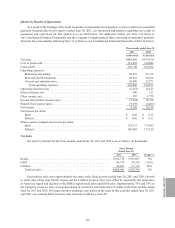
Operating expenses for the three months ended June 30, 2011 and 2010 were as follows (in thousands):
Three Months Ended June 30,
2011 2010 Change
As Restated As Revised
Marketing and selling . . . . . . . . . . . . . . . . . . . . . . . . . . . . . . . . . . . . . . . . . . $ 98,891 $ 91,338 8%
% of net sales . . . . . . . . . . . . . . . . . . . . . . . . . . . . . . . . . . . . . . . . . . . . . . 20.6% 19.1%
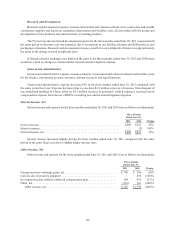
Research and development . . . . . . . . . . . . . . . . . . . . . . . . . . . . . . . . . . . . . . 40,022 38,264 5
% of net sales . . . . . . . . . . . . . . . . . . . . . . . . . . . . . . . . . . . . . . . . . . . . . . 8.3% 8.0%
General and administrative . . . . . . . . . . . . . . . . . . . . . . . . . . . . . . . . . . . . . 26,096 27,271 (4)
% of net sales . . . . . . . . . . . . . . . . . . . . . . . . . . . . . . . . . . . . . . . . . . . . . . 5.4% 5.7%
Total operating expenses . . . . . . . . . . . . . . . . . . . . . . . . . . . . . . . . . . . . . . . $165,009 $156,873 5
% of net sales . . . . . . . . . . . . . . . . . . . . . . . . . . . . . . . . . . . . . . . . . . . . . . 34.3% 32.7%
Approximately all increase in total operating expenses in the three months ended June 30, 2011 compared
with the same period in the prior year was due to investments in marketing, selling, research, and development
related to our LifeSize division.
We refer to our operating expenses excluding the impact of foreign currency exchange rates as constant
dollar operating expenses. Constant dollar operating expenses are a non-GAAP financial measure, which is
information derived from consolidated financial information but not presented in our financial statements prepared
in accordance with U.S. GAAP. Our management uses these non-GAAP measures in its financial and operational
decision-making, and believes these non-GAAP measures, when considered in conjunction with the corresponding
GAAP measures, facilitate a better understanding of changes in operating expenses. Constant dollar operating
expenses are calculated by translating prior period operating expenses in each local currency at the current period’s
average exchange rate for that currency.
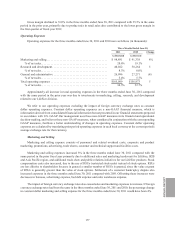
Marketing and Selling
Marketing and selling expense consists of personnel and related overhead costs, corporate and product
marketing, promotions, advertising, trade shows, customer and technical support and facilities costs.
Marketing and selling expenses increased 8% in the three months ended June 30, 2011 compared with the
same period in the prior fiscal year primarily due to additional sales and marketing headcount for LifeSize, B2B
and Asia Pacific region, and additional trade show and public relations initiatives for our LifeSize products. Stock
compensation costs also increased, due to the use of RSUs (restricted stock units) instead of stock options. RSUs
are less dilutive to shareholders because in general a smaller number of RSUs is granted, since the value at grant
of RSUs is generally greater than the value of stock options. Settlement of a customer bankruptcy dispute also
increased expenses in the three months ended June 30, 2011 compared with 2010. Offsetting these increases were
decreases in bonuses, advertising expense, bad debt expense and sales warehouse expense.
The impact of foreign currency exchange rates also caused sales and marketing expenses to increase. If foreign
currency exchange rates had been the same in the three months ended June 30, 2011 and 2010, the percentage change
in constant dollar marketing and selling expense for the three months ended June 30, 2011 would have been 4%.
ANNUAl REPORT
177