Logitech 2014 Annual Report Download - page 212
Download and view the complete annual report
Please find page 212 of the 2014 Logitech annual report below. You can navigate through the pages in the report by either clicking on the pages listed below, or by using the keyword search tool below to find specific information within the annual report.-
 1
1 -
2
-
3
-
4
-
5
-
6
-
7
-
8
-
9
-
10
-
11
-
12
-
13
-
14
-
15
-
16
-
17
-
18
-
19
-
20
-
21
-
22
-
23
-
24
-
25
-
26
-
27
-
28
-
29
-
30
-
31
-
32
-
33
-
34
-
35
-
36
-
37
-
38
-
39
-
40
-
41
-
42
-
43
-
44
-
45
-
46
-
47
-
48
-
49
-
50
-
51
-
52
-
53
-
54
-
55
-
56
-
57
-
58
-
59
-
60
-
61
-
62
-
63
-
64
-
65
-
66
-
67
-
68
-
69
-
70
-
71
-
72
-
73
-
74
-
75
-
76
-
77
-
78
-
79
-
80
-
81
-
82
-
83
-
84
-
85
-
86
-
87
-
88
-
89
-
90
-
91
-
92
-
93
-
94
-
95
-
96
-
97
-
98
-
99
-
100
-
101
-
102
-
103
-
104
-
105
-
106
-
107
-
108
-
109
-
110
-
111
-
112
-
113
-
114
-
115
-
116
-
117
-
118
-
119
-
120
-
121
-
122
-
123
-
124
-
125
-
126
-
127
-
128
-
129
-
130
-
131
-
132
-
133
-
134
-
135
-
136
-
137
-
138
-
139
-
140
-
141
-
142
-
143
-
144
-
145
-
146
-
147
-
148
-
149
-
150
-
151
-
152
-
153
-
154
-
155
-
156
-
157
-
158
-
159
-
160
-
161
-
162
-
163
-
164
-
165
-
166
-
167
-
168
-
169
-
170
-
171
-
172
-
173
-
174
-
175
-
176
-
177
-
178
-
179
-
180
-
181
-
182
-
183
-
184
-
185
-
186
-
187
-
188
-
189
-
190
-
191
-
192
-
193
-
194
-
195
-
196
-
197
-
198
-
199
-
200
-
201
-
 202
202 -
 203
203 -
 204
204 -
 205
205 -
 206
206 -
 207
207 -
 208
208 -
 209
209 -
 210
210 -
 211
211 -
 212
212 -
 213
213 -
 214
214 -
 215
215 -
 216
216 -
 217
217 -
 218
218 -
 219
219 -
 220
220 -
 221
221 -
 222
222 -
223
-
224
-
225
-
226
-
227
-
228
-
229
-
230
-
231
-
232
-
233
-
234
-
235
-
236
-
237
-
238
-
239
-
240
-
241
-
242
-
243
-
244
-
245
-
246
-
247
-
248
-
249
-
250
-
251
-
252
-
253
-
254
-
255
-
256
-
257
-
258
-
259
-
260
-
261
-
262
-
263
-
264
-
265
-
266
-
267
-
268
-
269
-
270
-
271
-
272
-
273
-
274
-
275
-
276
-
277
-
278
-
279
-
280
-
281
-
282
-
283
-
284
-
285
-
286
-
287
-
288
-
289
-
290
-
291
-
292
-
293
-
294
-
295
-
296
-
297
-
298
-
299
-
300
-
301
-
302
-
303
-
304
-
305
-
306
-
307
-
308
 |
 |

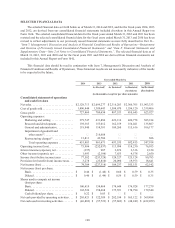
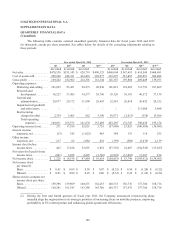
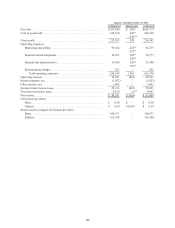
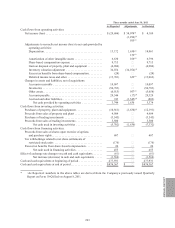
LOGITECH INTERNATIONAL S.A.
SUPPLEMENTARY DATA
QUARTERLY FINANCIAL DATA
(Unaudited)
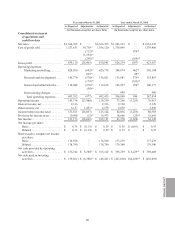
The following table contains selected unaudited quarterly financial data for fiscal years 2014 and 2013
(in thousands, except per share amounts). See tables below for details of the correcting adjustments relating to
these periods:
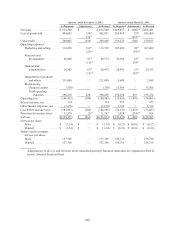
Year ended March 31, 2014 Year ended March 31, 2013
Q1 Q2(5) Q3 Q4(6) Q1(1) Q2 Q3(2) Q4(1)(3)
As revised As revised As revised As revised As revised As revised As revised
Net sales. . . . . . . . . . . . . . . . . $478,530 $531,143 $ 628,719 $ 490,321 $468,604 $ 547,693 $ 614,500 $ 468,481
Cost of goods sold . . . . . . . . . 309,268 348,181 414,418 328,977 323,297 351,887 405,051 309,408
Gross profit . . . . . . . . . . . . . . 169,262 182,962 214,301 161,344 145,307 195,806 209,449 159,073
Operating expenses:
Marketing and selling . . . 101,093 93,451 94,273 90,930 101,021 110,603 112,792 107,469
Research and
development . . . . . . . . 36,527 37,485 34,577 30,796 39,120 38,181 40,572 37,139
General and
administrative. . . . . . . 29,077 29,172 31,998 28,693 32,583 26,014 26,432 29,352
Impairment of goodwill
and other assets. . . . . . — — — — — — 211,000 5,688
Restructuring
charges/(credits) . . . . . 2,334 5,465 822 5,190 30,571 (2,015) (358) 15,506
Total operating
expenses . . . . . . . . 169,031 165,573 161,670 155,609 203,295 172,783 390,438 195,154
Operating income (loss). . . . . 231 17,389 52,631 5,735 (57,988) 23,023 (180,989) (36,081)
Interest income
(expense), net . . . . . . . . . . (23) 183 (1,022) 465 384 153 114 255
Other income
(expense), net . . . . . . . . . . 217 62 1,082 632 (159) (509) (3,670) 2,139
Income (loss) before
income taxes. . . . . . . . . . . 425 17,634 52,691 6,832 (57,763) 22,667 (184,545) (33,687)
Provision for (benefit from)
income taxes. . . . . . . . . . . (801) 3,058 4,807 (3,786) (6,910) (31,081) 11,367 814
Net income (loss) . . . . . . . . . . $ 1,226 $ 14,576 $ 47,884 $ 10,618 $ (50,853) $ 53,748 $(195,912) $ (34,501)
Net income (loss)
per share(4):
Basic. . . . . . . . . . . . . . . . . $ 0.01 $ 0.09 $ 0.30 $ 0.07 $ (0.32) $ 0.34 $ (1.24) $ (0.22)
Diluted . . . . . . . . . . . . . . . $ 0.01 $ 0.09 $ 0.29 $ 0.06 $ (0.32) $ 0.34 $ (1.24) $ (0.22)
Shares used to compute net
income (loss) per share:
Basic. . . . . . . . . . . . . . . . . 159,298 159,969 160,871 162,255 160,733 156,736 157,706 158,716
Diluted . . . . . . . . . . . . . . . 160,281 161,183 163,388 165,766 160,733 157,932 157,706 158,716
(1) During the first and fourth quarters of fiscal year 2013, the Company announced restructuring plans
intended align the organization to its strategic priorities of increasing focus on mobility products, improving
profitability in PC-related product and enhancing global operational efficiencies.
196