Logitech 2014 Annual Report Download - page 255
Download and view the complete annual report
Please find page 255 of the 2014 Logitech annual report below. You can navigate through the pages in the report by either clicking on the pages listed below, or by using the keyword search tool below to find specific information within the annual report.-
 1
1 -
2
-
3
-
4
-
5
-
6
-
7
-
8
-
9
-
10
-
11
-
12
-
13
-
14
-
15
-
16
-
17
-
18
-
19
-
20
-
21
-
22
-
23
-
24
-
25
-
26
-
27
-
28
-
29
-
30
-
31
-
32
-
33
-
34
-
35
-
36
-
37
-
38
-
39
-
40
-
41
-
42
-
43
-
44
-
45
-
46
-
47
-
48
-
49
-
50
-
51
-
52
-
53
-
54
-
55
-
56
-
57
-
58
-
59
-
60
-
61
-
62
-
63
-
64
-
65
-
66
-
67
-
68
-
69
-
70
-
71
-
72
-
73
-
74
-
75
-
76
-
77
-
78
-
79
-
80
-
81
-
82
-
83
-
84
-
85
-
86
-
87
-
88
-
89
-
90
-
91
-
92
-
93
-
94
-
95
-
96
-
97
-
98
-
99
-
100
-
101
-
102
-
103
-
104
-
105
-
106
-
107
-
108
-
109
-
110
-
111
-
112
-
113
-
114
-
115
-
116
-
117
-
118
-
119
-
120
-
121
-
122
-
123
-
124
-
125
-
126
-
127
-
128
-
129
-
130
-
131
-
132
-
133
-
134
-
135
-
136
-
137
-
138
-
139
-
140
-
141
-
142
-
143
-
144
-
145
-
146
-
147
-
148
-
149
-
150
-
151
-
152
-
153
-
154
-
155
-
156
-
157
-
158
-
159
-
160
-
161
-
162
-
163
-
164
-
165
-
166
-
167
-
168
-
169
-
170
-
171
-
172
-
173
-
174
-
175
-
176
-
177
-
178
-
179
-
180
-
181
-
182
-
183
-
184
-
185
-
186
-
187
-
188
-
189
-
190
-
191
-
192
-
193
-
194
-
195
-
196
-
197
-
198
-
199
-
200
-
201
-
202
-
203
-
204
-
205
-
206
-
207
-
208
-
209
-
210
-
211
-
212
-
213
-
214
-
215
-
216
-
217
-
218
-
219
-
220
-
221
-
222
-
223
-
224
-
225
-
226
-
227
-
228
-
229
-
230
-
231
-
232
-
233
-
234
-
235
-
236
-
237
-
238
-
239
-
240
-
241
-
242
-
243
-
244
-
 245
245 -
 246
246 -
 247
247 -
 248
248 -
 249
249 -
 250
250 -
 251
251 -
 252
252 -
 253
253 -
 254
254 -
 255
255 -
 256
256 -
 257
257 -
 258
258 -
 259
259 -
 260
260 -
 261
261 -
 262
262 -
 263
263 -
 264
264 -
 265
265 -
266
-
267
-
268
-
269
-
270
-
271
-
272
-
273
-
274
-
275
-
276
-
277
-
278
-
279
-
280
-
281
-
282
-
283
-
284
-
285
-
286
-
287
-
288
-
289
-
290
-
291
-
292
-
293
-
294
-
295
-
296
-
297
-
298
-
299
-
300
-
301
-
302
-
303
-
304
-
305
-
306
-
307
-
308
 |
 |

LOGITECH INTERNATIONAL S.A.
NOTES TO CONSOLIDATED FINANCIAL STATEMENTS (Continued)
Advertising Costs
Advertising costs are expensed as incurred. Advertising costs are recorded as either a marketing and selling
expense or a deduction from revenue. Advertising costs reimbursed by the Company to direct or indirect customers
must have an identifiable benefit and an estimable fair value in order to be classified as an operating expense. If
these criteria are not met, the cost is classified as a reduction of revenue. Advertising costs during fiscal years 2014,
2013 and 2012 were $161.2 million, $165.8 million and $168.0 million, respectively.
Cash Equivalents
The Company considers all highly liquid instruments purchased with an original maturity of three months or
less to be cash equivalents.
Concentration of Credit Risk
Financial instruments that potentially subject the Company to concentrations of credit risk consist principally
of cash and cash equivalents and accounts receivable. The Company maintains cash and cash equivalents with
various financial institutions to limit exposure with any one financial institution, but is exposed to credit risk in the
event of default by financial institutions to the extent that cash balances with individual financial institutions are
in excess of amounts that are insured.
The Company sells to large OEMs, distributors and retailers and, as a result, maintains individually significant
receivable balances with such customers. In fiscal years 2014, 2013 and 2012, one customer in the peripherals
operating segment represented 14%, 11% and 14% of net sales, respectively. No other customer represented more
than 10% of the Company’s total net sales during fiscal years 2014, 2013 and 2012. As of both March 31, 2014 and
2013, one customer represented 14% of total accounts receivable. No other customer represented more than 10% of
the Company’s total accounts receivable at either March 31, 2014 or 2013. Typical payment terms require customers
to pay for product sales generally within 30 to 60 days; however terms may vary by customer type, by country and
by selling season. Extended payment terms are sometimes offered to a limited number of customers during the
second and third fiscal quarters. The Company does not modify payment terms on existing receivables.
The Company’s OEM customers tend to be well-capitalized multi-national companies, while distributors
and key retailers may be less well-capitalized. The Company manages its accounts receivable credit risk through
ongoing credit evaluation of its customers’ financial condition. The Company generally does not require collateral
from its customers.
Allowances for Doubtful Accounts
Allowances for doubtful accounts are maintained for estimated losses resulting from the inability of the
Company’s customers to make required payments. The allowances are based on the Company’s regular assessment
of the credit worthiness and financial condition of specific customers, as well as its historical experience with bad
debts and customer deductions, receivables aging, current economic trends, geographic or country-specific risks
and the financial condition of its distribution channels.
Inventories
Inventories are stated at the lower of cost or market. Costs are computed under the standard cost method,
which approximates actual costs determined on the first-in, first-out basis. The Company records write-downs
of inventories which are obsolete or in excess of anticipated demand or market value based on a consideration of
marketability and product life cycle stage, product development plans, component cost trends, demand forecasts,
historical net sales, and assumptions about future demand and market conditions.
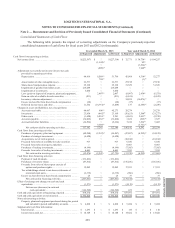
Note 3 — Summary of Significant Accounting Policies (Continued)
ANNUAl REPORT
239