Logitech 2014 Annual Report Download - page 184
Download and view the complete annual report
Please find page 184 of the 2014 Logitech annual report below. You can navigate through the pages in the report by either clicking on the pages listed below, or by using the keyword search tool below to find specific information within the annual report.-
 1
1 -
2
-
3
-
4
-
5
-
6
-
7
-
8
-
9
-
10
-
11
-
12
-
13
-
14
-
15
-
16
-
17
-
18
-
19
-
20
-
21
-
22
-
23
-
24
-
25
-
26
-
27
-
28
-
29
-
30
-
31
-
32
-
33
-
34
-
35
-
36
-
37
-
38
-
39
-
40
-
41
-
42
-
43
-
44
-
45
-
46
-
47
-
48
-
49
-
50
-
51
-
52
-
53
-
54
-
55
-
56
-
57
-
58
-
59
-
60
-
61
-
62
-
63
-
64
-
65
-
66
-
67
-
68
-
69
-
70
-
71
-
72
-
73
-
74
-
75
-
76
-
77
-
78
-
79
-
80
-
81
-
82
-
83
-
84
-
85
-
86
-
87
-
88
-
89
-
90
-
91
-
92
-
93
-
94
-
95
-
96
-
97
-
98
-
99
-
100
-
101
-
102
-
103
-
104
-
105
-
106
-
107
-
108
-
109
-
110
-
111
-
112
-
113
-
114
-
115
-
116
-
117
-
118
-
119
-
120
-
121
-
122
-
123
-
124
-
125
-
126
-
127
-
128
-
129
-
130
-
131
-
132
-
133
-
134
-
135
-
136
-
137
-
138
-
139
-
140
-
141
-
142
-
143
-
144
-
145
-
146
-
147
-
148
-
149
-
150
-
151
-
152
-
153
-
154
-
155
-
156
-
157
-
158
-
159
-
160
-
161
-
162
-
163
-
164
-
165
-
166
-
167
-
168
-
169
-
170
-
171
-
172
-
173
-
 174
174 -
 175
175 -
 176
176 -
 177
177 -
 178
178 -
 179
179 -
 180
180 -
 181
181 -
 182
182 -
 183
183 -
 184
184 -
 185
185 -
 186
186 -
 187
187 -
 188
188 -
 189
189 -
 190
190 -
 191
191 -
 192
192 -
 193
193 -
 194
194 -
195
-
196
-
197
-
198
-
199
-
200
-
201
-
202
-
203
-
204
-
205
-
206
-
207
-
208
-
209
-
210
-
211
-
212
-
213
-
214
-
215
-
216
-
217
-
218
-
219
-
220
-
221
-
222
-
223
-
224
-
225
-
226
-
227
-
228
-
229
-
230
-
231
-
232
-
233
-
234
-
235
-
236
-
237
-
238
-
239
-
240
-
241
-
242
-
243
-
244
-
245
-
246
-
247
-
248
-
249
-
250
-
251
-
252
-
253
-
254
-
255
-
256
-
257
-
258
-
259
-
260
-
261
-
262
-
263
-
264
-
265
-
266
-
267
-
268
-
269
-
270
-
271
-
272
-
273
-
274
-
275
-
276
-
277
-
278
-
279
-
280
-
281
-
282
-
283
-
284
-
285
-
286
-
287
-
288
-
289
-
290
-
291
-
292
-
293
-
294
-
295
-
296
-
297
-
298
-
299
-
300
-
301
-
302
-
303
-
304
-
305
-
306
-
307
-
308
 |
 |

DSO as of March 31, 2014 remained flat compared to March 31, 2013.
DSO as of March 31, 2013 decreased 4 days, compared to March 31, 2012. The decrease was primarily due to
improvement in cash collections.
Typical payment terms require customers to pay for product sales generally within 30 to 60 days. However,
terms may vary by customer type, by country and by selling season. Extended payment terms are sometimes
offered to a limited number of customers during the quarters ended September 30 and December 31. We do not
modify payment terms on existing receivables, but may offer discounts for early payment.
ITO as of March 31, 2014 increased, compared to March 31, 2013. The increase was primarily due to lower
inventory levels in relation to net sales during the fourth quarter of fiscal year 2014.
ITO as of March 31, 2013 increased, compared to March 31, 2012. The increase was primarily due to lower
inventory levels at March 31, 2013 in relation to net sales during the fourth quarter of fiscal year 2013.
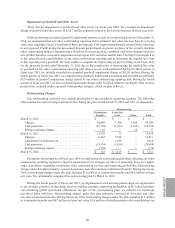
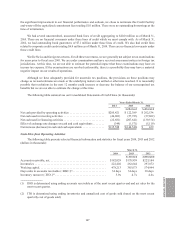
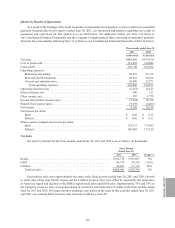
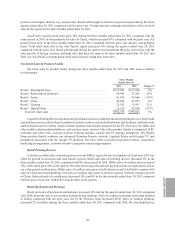
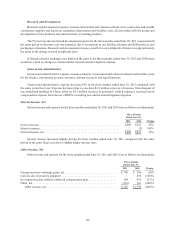
Cash Flow from Investing Activities
Years Ended March 31,
2014 2013 2012
As Revised As Restated
Purchases of property, plant and equipment . . . . . . . . . . . . . . . . . . . . . . . . (46,658)(54,487)(54,199)
Purchase of strategic investment . . . . . . . . . . . . . . . . . . . . . . . . . . . . . . . . . (300)(4,420)—
Acquisitions, net of cash acquired . . . . . . . . . . . . . . . . . . . . . . . . . . . . . . . . (650)— (18,814)
Proceeds from sales of available-for-sale securities. . . . . . . . . . . . . . . . . . . — 917 6,550
Proceeds from return of investment from strategic investments . . . . . . . . . 261 — —
Proceeds from sales of property and equipment . . . . . . . . . . . . . . . . . . . . . — — 8,967
Purchase of trading investments . . . . . . . . . . . . . . . . . . . . . . . . . . . . . . . . . (8,450)(4,196)(7,505)
Proceeds from sales of trading investments . . . . . . . . . . . . . . . . . . . . . . . . . 8,994 4,463 7,399
(46,803) (57,723) (57,602)
Our expenditures for property, plant and equipment during fiscal year 2014, 2013 and 2012 were primarily
expenditures for leasehold improvements, computer hardware and software, tooling and equipment.
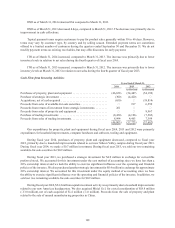
During fiscal year 2014, purchases of property, plant and equipment decreased, compared to fiscal year
2013, primarily due to leasehold improvements related to our new Silicon Valley campus during fiscal year 2013.
During fiscal year 2014, we made a $0.7 million investment. During fiscal year 2013, we sold our two remaining
available-for-sale securities for $0.9 million.
During fiscal year 2013, we purchased a strategic investment for $4.0 million in exchange for convertible
preferred stock. We accounted for this investment under the cost method of accounting since we have less than a
20% ownership interest and we lack the ability to exercise significant influence over the operating and financial
policies of the investee. We also purchased another strategic investment for $0.4 million in exchange for approximate
20% ownership interest. We accounted for this investment under the equity method of accounting since we have
the ability to exercise significant influence over the operating and financial policies of the investee. In addition, we
sold our two remaining available-for-sale securities for $0.9 million.
During fiscal year 2012, $54.2 million capital investment activity was primarily due to leasehold improvements
related to our new Americas headquarters. We also acquired Mirial S.r.l. for a total consideration of $18.8 million
(€13.0 million), net of cash acquired of $1.4 million (€1.0 million). Proceeds from the sale of property and plant
related to the sale of unused manufacturing properties in China.
168