Logitech 2014 Annual Report Download - page 215
Download and view the complete annual report
Please find page 215 of the 2014 Logitech annual report below. You can navigate through the pages in the report by either clicking on the pages listed below, or by using the keyword search tool below to find specific information within the annual report.-
 1
1 -
2
-
3
-
4
-
5
-
6
-
7
-
8
-
9
-
10
-
11
-
12
-
13
-
14
-
15
-
16
-
17
-
18
-
19
-
20
-
21
-
22
-
23
-
24
-
25
-
26
-
27
-
28
-
29
-
30
-
31
-
32
-
33
-
34
-
35
-
36
-
37
-
38
-
39
-
40
-
41
-
42
-
43
-
44
-
45
-
46
-
47
-
48
-
49
-
50
-
51
-
52
-
53
-
54
-
55
-
56
-
57
-
58
-
59
-
60
-
61
-
62
-
63
-
64
-
65
-
66
-
67
-
68
-
69
-
70
-
71
-
72
-
73
-
74
-
75
-
76
-
77
-
78
-
79
-
80
-
81
-
82
-
83
-
84
-
85
-
86
-
87
-
88
-
89
-
90
-
91
-
92
-
93
-
94
-
95
-
96
-
97
-
98
-
99
-
100
-
101
-
102
-
103
-
104
-
105
-
106
-
107
-
108
-
109
-
110
-
111
-
112
-
113
-
114
-
115
-
116
-
117
-
118
-
119
-
120
-
121
-
122
-
123
-
124
-
125
-
126
-
127
-
128
-
129
-
130
-
131
-
132
-
133
-
134
-
135
-
136
-
137
-
138
-
139
-
140
-
141
-
142
-
143
-
144
-
145
-
146
-
147
-
148
-
149
-
150
-
151
-
152
-
153
-
154
-
155
-
156
-
157
-
158
-
159
-
160
-
161
-
162
-
163
-
164
-
165
-
166
-
167
-
168
-
169
-
170
-
171
-
172
-
173
-
174
-
175
-
176
-
177
-
178
-
179
-
180
-
181
-
182
-
183
-
184
-
185
-
186
-
187
-
188
-
189
-
190
-
191
-
192
-
193
-
194
-
195
-
196
-
197
-
198
-
199
-
200
-
201
-
202
-
203
-
204
-
 205
205 -
 206
206 -
 207
207 -
 208
208 -
 209
209 -
 210
210 -
 211
211 -
 212
212 -
 213
213 -
 214
214 -
 215
215 -
 216
216 -
 217
217 -
 218
218 -
 219
219 -
 220
220 -
 221
221 -
 222
222 -
 223
223 -
 224
224 -
 225
225 -
226
-
227
-
228
-
229
-
230
-
231
-
232
-
233
-
234
-
235
-
236
-
237
-
238
-
239
-
240
-
241
-
242
-
243
-
244
-
245
-
246
-
247
-
248
-
249
-
250
-
251
-
252
-
253
-
254
-
255
-
256
-
257
-
258
-
259
-
260
-
261
-
262
-
263
-
264
-
265
-
266
-
267
-
268
-
269
-
270
-
271
-
272
-
273
-
274
-
275
-
276
-
277
-
278
-
279
-
280
-
281
-
282
-
283
-
284
-
285
-
286
-
287
-
288
-
289
-
290
-
291
-
292
-
293
-
294
-
295
-
296
-
297
-
298
-
299
-
300
-
301
-
302
-
303
-
304
-
305
-
306
-
307
-
308
 |
 |

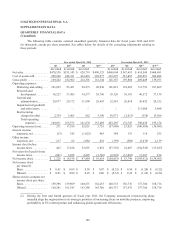
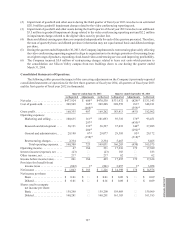
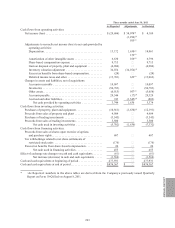
Quarter ended June 30, 2012 Quarter ended September 30, 2012
As Reported Adjustments As Revised As Reported Adjustments As Revised
Net sales. . . . . . . . . . . . . . . . . . . . . . $468,604 $ — $468,604 $ 547,693 $ — $ 547,693
Cost of goods sold . . . . . . . . . . . . . . 323,258 149(2) 323,297 351,919 110(2) 351,887
(110)(4) (142)(4)
Gross profit . . . . . . . . . . . . . . . . . . . 145,346 (39) 145,307 195,774 32 195,806
Operating expenses:
Marketing and selling . . . . . . . . 100,897 145(2) 101,021 110,522 107(2) 110,603
(21)(4) (26)(4)
Research and development. . . . . 39,023 118(2) 39,120 38,114 88(2) 38,181
(21)(4) (21)(4)
General and administrative . . . . 32,480 78(2) 32,583 25,980 58(2) 26,014
25(4) (24)(4)
Restructuring
charges/(credits) . . . . . . . . . . 31,227 (656)(4) 30,571 (2,671) 656(4) (2,015)
Total operating expenses . . . 203,627 (332) 203,295 171,945 838 172,783
Operating income (loss). . . . . . . . . . (58,281) 293 (57,988) 23,829 (806) 23,023
Interest income, net . . . . . . . . . . . . . 384 — 384 153 — 153
Other expense, net . . . . . . . . . . . . . . (159) — (159) (509) — (509)
Income (loss) before
income taxes. . . . . . . . . . . . . . . . (58,056) 293 (57,763) 23,473 (806) 22,667
Benefit from income taxes . . . . . . . (6,910) — (6,910) (31,076) (5)(4) (31,081)
Net income (loss) . . . . . . . . . . . . . . . $ (51,146) $ 293 $ (50,853) $ 54,549 $ (801) $ 53,748
Net income (loss) per share:
Basic. . . . . . . . . . . . . . . . . . . . . . $ (0.32) $ — $ (0.32) $ 0.35 $ (0.01) $ 0.34
Diluted . . . . . . . . . . . . . . . . . . . . $ (0.32) $ — $ (0.32) $ 0.35 $ (0.01) $ 0.34
Shares used to compute net income
(loss) per share:
Basic. . . . . . . . . . . . . . . . . . . . . . 160,733 — 160,733 156,736 — 156,736
Diluted . . . . . . . . . . . . . . . . . . . . 160,733 — 160,733 157,932 — 157,932
ANNUAl REPORT
199