Logitech 2014 Annual Report Download - page 289
Download and view the complete annual report
Please find page 289 of the 2014 Logitech annual report below. You can navigate through the pages in the report by either clicking on the pages listed below, or by using the keyword search tool below to find specific information within the annual report.-
 1
1 -
2
-
3
-
4
-
5
-
6
-
7
-
8
-
9
-
10
-
11
-
12
-
13
-
14
-
15
-
16
-
17
-
18
-
19
-
20
-
21
-
22
-
23
-
24
-
25
-
26
-
27
-
28
-
29
-
30
-
31
-
32
-
33
-
34
-
35
-
36
-
37
-
38
-
39
-
40
-
41
-
42
-
43
-
44
-
45
-
46
-
47
-
48
-
49
-
50
-
51
-
52
-
53
-
54
-
55
-
56
-
57
-
58
-
59
-
60
-
61
-
62
-
63
-
64
-
65
-
66
-
67
-
68
-
69
-
70
-
71
-
72
-
73
-
74
-
75
-
76
-
77
-
78
-
79
-
80
-
81
-
82
-
83
-
84
-
85
-
86
-
87
-
88
-
89
-
90
-
91
-
92
-
93
-
94
-
95
-
96
-
97
-
98
-
99
-
100
-
101
-
102
-
103
-
104
-
105
-
106
-
107
-
108
-
109
-
110
-
111
-
112
-
113
-
114
-
115
-
116
-
117
-
118
-
119
-
120
-
121
-
122
-
123
-
124
-
125
-
126
-
127
-
128
-
129
-
130
-
131
-
132
-
133
-
134
-
135
-
136
-
137
-
138
-
139
-
140
-
141
-
142
-
143
-
144
-
145
-
146
-
147
-
148
-
149
-
150
-
151
-
152
-
153
-
154
-
155
-
156
-
157
-
158
-
159
-
160
-
161
-
162
-
163
-
164
-
165
-
166
-
167
-
168
-
169
-
170
-
171
-
172
-
173
-
174
-
175
-
176
-
177
-
178
-
179
-
180
-
181
-
182
-
183
-
184
-
185
-
186
-
187
-
188
-
189
-
190
-
191
-
192
-
193
-
194
-
195
-
196
-
197
-
198
-
199
-
200
-
201
-
202
-
203
-
204
-
205
-
206
-
207
-
208
-
209
-
210
-
211
-
212
-
213
-
214
-
215
-
216
-
217
-
218
-
219
-
220
-
221
-
222
-
223
-
224
-
225
-
226
-
227
-
228
-
229
-
230
-
231
-
232
-
233
-
234
-
235
-
236
-
237
-
238
-
239
-
240
-
241
-
242
-
243
-
244
-
245
-
246
-
247
-
248
-
249
-
250
-
251
-
252
-
253
-
254
-
255
-
256
-
257
-
258
-
259
-
260
-
261
-
262
-
263
-
264
-
265
-
266
-
267
-
268
-
269
-
270
-
271
-
272
-
273
-
274
-
275
-
276
-
277
-
278
-
 279
279 -
 280
280 -
 281
281 -
 282
282 -
 283
283 -
 284
284 -
 285
285 -
 286
286 -
 287
287 -
 288
288 -
 289
289 -
 290
290 -
 291
291 -
 292
292 -
 293
293 -
 294
294 -
 295
295 -
 296
296 -
 297
297 -
 298
298 -
 299
299 -
300
-
301
-
302
-
303
-
304
-
305
-
306
-
307
-
308
 |
 |

LOGITECH INTERNATIONAL S.A.
NOTES TO CONSOLIDATED FINANCIAL STATEMENTS (Continued)
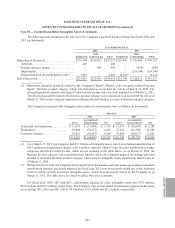
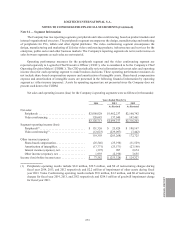
Note 14 — Segment Information
The Company has two reporting segments, peripherals and video conferencing, based on product markets and
internal organizational structure. The peripherals segment encompasses the design, manufacturing and marketing
of peripherals for PCs, tablets and other digital platforms. The video conferencing segment encompasses the
design, manufacturing and marketing of Lifesize video conferencing products, infrastructure and services for the
enterprise, public sector and other business markets. The Company’s reporting segments do not record revenue on
sales between segments as such sales are not material.
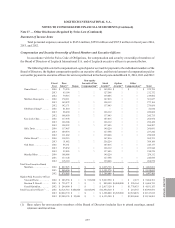
Operating performance measures for the peripherals segment and the video conferencing segment are
reported separately to Logitech’s Chief Executive Officer (“CEO”), who is considered to be the Company’s Chief
Operating Decision Maker (“CODM”). The CEO periodically reviews information such as net sales and operating
income (loss) for each operating segment to make business decisions. These operating performance measures do
not include share-based compensation expense and amortization of intangible assets. Share-based compensation
expense and amortization of intangible assets are presented in the following financial information by operating
segment as “other income (expense).” Assets by operating segment are not presented since the Company does not
present such data to the CODM.
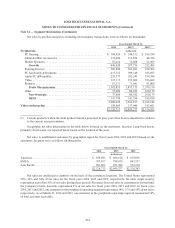
Net sales and operating income (loss) for the Company’s operating segments were as follows (in thousands):
Years Ended March 31,
2014 2013 2012
As Revised As Restated
Net sales:
Peripherals . . . . . . . . . . . . . . . . . . . . . . . . . . . . . . . . $2,008,028 $1,962,237 $2,168,742
Video conferencing . . . . . . . . . . . . . . . . . . . . . . . . . 120,685 137,040 147,461
$2,128,713 $2,099,277 $2,316,203
Segment operating income (loss):
Peripherals(1) . . . . . . . . . . . . . . . . . . . . . . . . . . . . . . . $ 131,326 $ 25,829 $ 180,167
Video conferencing(1) . . . . . . . . . . . . . . . . . . . . . . . . (12,023) (229,097) (7,442)
119,303 (203,268) 172,725
Other income (expense):
Share-based compensation . . . . . . . . . . . . . . . . . . . . (25,546) (25,198) (31,529)
Amortization of intangibles . . . . . . . . . . . . . . . . . . . (17,771) (23,571) (27,198)
Interest income (expense), net . . . . . . . . . . . . . . . . . (397) 907 2,674
Other income (expense), net. . . . . . . . . . . . . . . . . . . 1,993 (2,198) 7,655
Income (loss) before income taxes . . . . . . . . . . . . . . . . $ 77,582 $ (253,328) $ 124,327
(1) Peripherals operating results include $8.0 million, $39.5 million, and $0 of restructuring charges during
fiscal year 2014, 2013, and 2012 respectively and $2.2 million of impairment of other assets during fiscal
year 2013. Video Conferencing operating results include $5.8 million, $4.2 million, and $0 of restructuring
charges for fiscal year 2014, 2013, and 2012 respectively and $214.5 million of goodwill impairment charge
for fiscal year 2013.
ANNUAl REPORT
273