Logitech 2014 Annual Report Download - page 171
Download and view the complete annual report
Please find page 171 of the 2014 Logitech annual report below. You can navigate through the pages in the report by either clicking on the pages listed below, or by using the keyword search tool below to find specific information within the annual report.-
 1
1 -
2
-
3
-
4
-
5
-
6
-
7
-
8
-
9
-
10
-
11
-
12
-
13
-
14
-
15
-
16
-
17
-
18
-
19
-
20
-
21
-
22
-
23
-
24
-
25
-
26
-
27
-
28
-
29
-
30
-
31
-
32
-
33
-
34
-
35
-
36
-
37
-
38
-
39
-
40
-
41
-
42
-
43
-
44
-
45
-
46
-
47
-
48
-
49
-
50
-
51
-
52
-
53
-
54
-
55
-
56
-
57
-
58
-
59
-
60
-
61
-
62
-
63
-
64
-
65
-
66
-
67
-
68
-
69
-
70
-
71
-
72
-
73
-
74
-
75
-
76
-
77
-
78
-
79
-
80
-
81
-
82
-
83
-
84
-
85
-
86
-
87
-
88
-
89
-
90
-
91
-
92
-
93
-
94
-
95
-
96
-
97
-
98
-
99
-
100
-
101
-
102
-
103
-
104
-
105
-
106
-
107
-
108
-
109
-
110
-
111
-
112
-
113
-
114
-
115
-
116
-
117
-
118
-
119
-
120
-
121
-
122
-
123
-
124
-
125
-
126
-
127
-
128
-
129
-
130
-
131
-
132
-
133
-
134
-
135
-
136
-
137
-
138
-
139
-
140
-
141
-
142
-
143
-
144
-
145
-
146
-
147
-
148
-
149
-
150
-
151
-
152
-
153
-
154
-
155
-
156
-
157
-
158
-
159
-
160
-
 161
161 -
 162
162 -
 163
163 -
 164
164 -
 165
165 -
 166
166 -
 167
167 -
 168
168 -
 169
169 -
 170
170 -
 171
171 -
 172
172 -
 173
173 -
 174
174 -
 175
175 -
 176
176 -
 177
177 -
 178
178 -
 179
179 -
 180
180 -
 181
181 -
182
-
183
-
184
-
185
-
186
-
187
-
188
-
189
-
190
-
191
-
192
-
193
-
194
-
195
-
196
-
197
-
198
-
199
-
200
-
201
-
202
-
203
-
204
-
205
-
206
-
207
-
208
-
209
-
210
-
211
-
212
-
213
-
214
-
215
-
216
-
217
-
218
-
219
-
220
-
221
-
222
-
223
-
224
-
225
-
226
-
227
-
228
-
229
-
230
-
231
-
232
-
233
-
234
-
235
-
236
-
237
-
238
-
239
-
240
-
241
-
242
-
243
-
244
-
245
-
246
-
247
-
248
-
249
-
250
-
251
-
252
-
253
-
254
-
255
-
256
-
257
-
258
-
259
-
260
-
261
-
262
-
263
-
264
-
265
-
266
-
267
-
268
-
269
-
270
-
271
-
272
-
273
-
274
-
275
-
276
-
277
-
278
-
279
-
280
-
281
-
282
-
283
-
284
-
285
-
286
-
287
-
288
-
289
-
290
-
291
-
292
-
293
-
294
-
295
-
296
-
297
-
298
-
299
-
300
-
301
-
302
-
303
-
304
-
305
-
306
-
307
-
308
 |
 |

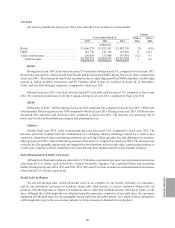
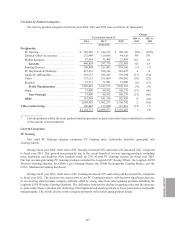
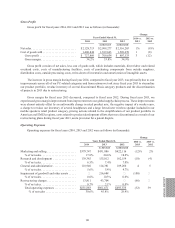
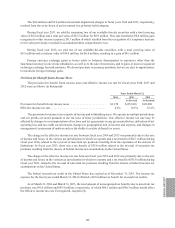
Net Sales
Net sales by channel for fiscal years 2014, 2013 and 2012 were as follows (in thousands):
Years Ended March 31,
Change
2014 vs.
2013
2013 vs.
20122014 2013 2012
As Revised
Retail ................................. $1,866,279 $1,821,051 $1,982,783 2% (8)%
OEM.................................. 141,749 141,186 185,959 0 (24)
Video conferencing ...................... 120,685 137,040 147,461 (12) (7)
Total net sales........................ $2,128,713 $ 2,099,277 $2,316,203 1 (9)
Retail:
During fiscal year 2014, retail sales increased 2% and units sold decreased 3%, compared to fiscal year 2013.
Retail sales increased in Americas and Asia Pacific and decreased in EMEA during fiscal year 2014, compared to
fiscal year 2013. The increase in retail sales is primarily due to triple-digit growth in Mobile Speakers, double-digit
growth in Tablets & Other Accessories and PC Gaming, offset in part by a decline in Audio-PC & Wearables,
Video, and our Non-Strategic categories, compared to fiscal year 2013.
During fiscal year 2013, our retail sales decreased 8% and units sold decreased 7%, compared to fiscal year
2012. We experienced decreases in all three regions during fiscal year 2013, compared to fiscal year 2012.
OEM:
OEM sales of $141.7 million during fiscal year 2014 remained flat compared to fiscal year 2013. OEM units
sold remained flat during fiscal year 2014 compared with fiscal year 2013. During fiscal year 2013, OEM net sales
decreased 24% and units sold decreased 12%, compared to fiscal year 2012. The decrease was primarily due to
lower sales in the keyboard/desktop category and pointing devices.
Lifesize:
During fiscal year 2014, video conferencing net sales decreased 12%, compared to fiscal year 2013. The
decrease primarily resulted from the combination of a changing industry landscape caused by a shift to less
expensive, cloud-based video conferencing solutions, an evolving Lifesize product line and challenges in execution.
During fiscal year 2013, video conferencing net sales decreased 7%, compared to fiscal year 2012. The decrease was
reflected in all geographic regions and was impacted by the slowdown in the overall video conferencing industry in
recent years, together with the competitive environment and lower demand related to new product launches.
Sales Denominated in Other Currencies
Although our financial results are reported in U.S. Dollars, a portion of our sales were generated in currencies
other than the U.S. dollar, such as the Euro, Chinese Renminbi, Japanese Yen, Canadian Dollar and Australian
Dollar. During fiscal years 2014, 2013 and 2012, 45%, 45% and 45% of our net sales were denominated in currencies
other than the U.S. Dollar, respectively.
Retail Sales by Region
We use sell-through data, which represents sales of our products by our retailer customers to consumers,
and by our distributor customers to resellers, along with other metrics, to assess consumer demand for our
products. Sell-through data is subject to limitations due to collection methods and the third-party nature of the
data. Although the sell-through data we obtained typically represents a majority of our retail sales, the customers
supplying sell-through data vary by geographic region and from period-to-period. As a result of these limitations,
sell-through data may not be an accurate indicator of actual consumer demand for our products.
ANNUAl REPORT
155