Logitech 2014 Annual Report Download - page 270
Download and view the complete annual report
Please find page 270 of the 2014 Logitech annual report below. You can navigate through the pages in the report by either clicking on the pages listed below, or by using the keyword search tool below to find specific information within the annual report.-
 1
1 -
2
-
3
-
4
-
5
-
6
-
7
-
8
-
9
-
10
-
11
-
12
-
13
-
14
-
15
-
16
-
17
-
18
-
19
-
20
-
21
-
22
-
23
-
24
-
25
-
26
-
27
-
28
-
29
-
30
-
31
-
32
-
33
-
34
-
35
-
36
-
37
-
38
-
39
-
40
-
41
-
42
-
43
-
44
-
45
-
46
-
47
-
48
-
49
-
50
-
51
-
52
-
53
-
54
-
55
-
56
-
57
-
58
-
59
-
60
-
61
-
62
-
63
-
64
-
65
-
66
-
67
-
68
-
69
-
70
-
71
-
72
-
73
-
74
-
75
-
76
-
77
-
78
-
79
-
80
-
81
-
82
-
83
-
84
-
85
-
86
-
87
-
88
-
89
-
90
-
91
-
92
-
93
-
94
-
95
-
96
-
97
-
98
-
99
-
100
-
101
-
102
-
103
-
104
-
105
-
106
-
107
-
108
-
109
-
110
-
111
-
112
-
113
-
114
-
115
-
116
-
117
-
118
-
119
-
120
-
121
-
122
-
123
-
124
-
125
-
126
-
127
-
128
-
129
-
130
-
131
-
132
-
133
-
134
-
135
-
136
-
137
-
138
-
139
-
140
-
141
-
142
-
143
-
144
-
145
-
146
-
147
-
148
-
149
-
150
-
151
-
152
-
153
-
154
-
155
-
156
-
157
-
158
-
159
-
160
-
161
-
162
-
163
-
164
-
165
-
166
-
167
-
168
-
169
-
170
-
171
-
172
-
173
-
174
-
175
-
176
-
177
-
178
-
179
-
180
-
181
-
182
-
183
-
184
-
185
-
186
-
187
-
188
-
189
-
190
-
191
-
192
-
193
-
194
-
195
-
196
-
197
-
198
-
199
-
200
-
201
-
202
-
203
-
204
-
205
-
206
-
207
-
208
-
209
-
210
-
211
-
212
-
213
-
214
-
215
-
216
-
217
-
218
-
219
-
220
-
221
-
222
-
223
-
224
-
225
-
226
-
227
-
228
-
229
-
230
-
231
-
232
-
233
-
234
-
235
-
236
-
237
-
238
-
239
-
240
-
241
-
242
-
243
-
244
-
245
-
246
-
247
-
248
-
249
-
250
-
251
-
252
-
253
-
254
-
255
-
256
-
257
-
258
-
259
-
 260
260 -
 261
261 -
 262
262 -
 263
263 -
 264
264 -
 265
265 -
 266
266 -
 267
267 -
 268
268 -
 269
269 -
 270
270 -
 271
271 -
 272
272 -
 273
273 -
 274
274 -
 275
275 -
 276
276 -
 277
277 -
 278
278 -
 279
279 -
 280
280 -
281
-
282
-
283
-
284
-
285
-
286
-
287
-
288
-
289
-
290
-
291
-
292
-
293
-
294
-
295
-
296
-
297
-
298
-
299
-
300
-
301
-
302
-
303
-
304
-
305
-
306
-
307
-
308
 |
 |

LOGITECH INTERNATIONAL S.A.
NOTES TO CONSOLIDATED FINANCIAL STATEMENTS (Continued)
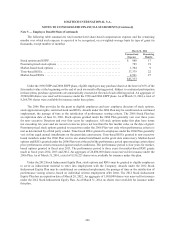
Note 5 — Employee Benefit Plans (Continued)
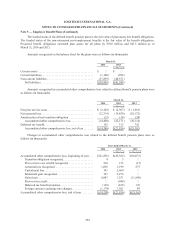
The fair value of the deferred compensation plan’s assets is included in other assets in the consolidated
balance sheets. The marketable securities are classified as trading investments and were recorded at a fair value of
$16.6 million and $15.6 million as of March 31, 2014 and 2013, based on quoted market prices. The Company also
had $16.6 million and $15.6 million deferred compensation liability as of March 31, 2014 and 2013, respectively.
Earnings, gains and losses on trading investments are included in other income (expense), net and corresponding
changes in deferred compensation liability are included in operating expenses and cost of goods sold.
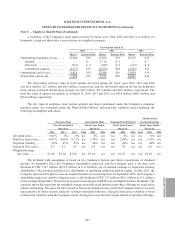
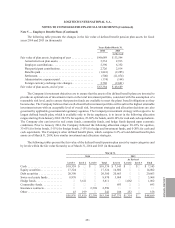
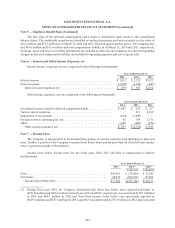
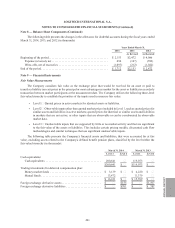
Note 6 — Interest and Other Income (Expense), net
Interest income (expense), net was comprised of the following (in thousands):
Years Ended March 31,
2014 2013 2012
Interest income . . . . . . . . . . . . . . . . . . . . . . . . . . . . . . . . . . . . . . . . . . . . . . . . . . $ 1,831 $ 2,215 $
3,121
Interest expense . . . . . . . . . . . . . . . . . . . . . . . . . . . . . . . . . . . . . . . . . . . . . . . . . . (2,228) (1,308) (447)
Interest income (expense), net . . . . . . . . . . . . . . . . . . . . . . . . . . . . . . . . . . . . $
(397
) $
907
$
2,674
Other income (expense), net was comprised of the following (in thousands):
Years Ended March 31,
2014 2013 2012
Investment income related to deferred compensation plan. . . . . . . . . . . . . . . . . . $1,487 $ 933 $
227
Gain on sale of securities. . . . . . . . . . . . . . . . . . . . . . . . . . . . . . . . . . . . . . . . . . . . — 831 6,109
Impairment of investments . . . . . . . . . . . . . . . . . . . . . . . . . . . . . . . . . . . . . . . . . . (624) (3,600) —
Foreign currency exchange gain, net. . . . . . . . . . . . . . . . . . . . . . . . . . . . . . . . . . . 62 104 1,575
Other . . . . . . . . . . . . . . . . . . . . . . . . . . . . . . . . . . . . . . . . . . . . . . . . . . . . . . . . . . . 1,068 (466) (256)
Other income (expense), net. . . . . . . . . . . . . . . . . . . . . . . . . . . . . . . . . . . . . . . $
1,993
$
(2,198
) $
7,655
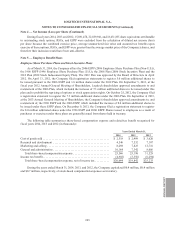
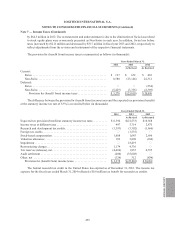
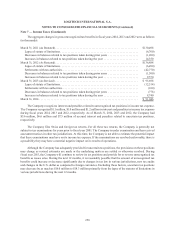
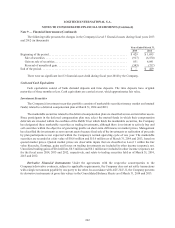
Note 7 — Income Taxes
The Company is incorporated in Switzerland but operates in various countries with differing tax laws and
rates. Further, a portion of the Company’s income (loss) before taxes and the provision for (benefit from) income
taxes is generated outside of Switzerland.
Income (loss) before income taxes for the fiscal years 2014, 2013 and 2012 is summarized as follows
(in thousands):
Years Ended March 31,
2014 2013(1) 2012(1)
As Revised As Restated
Swiss . . . . . . . . . . . . . . . . . . . . . . . . . . . . . . . . . . . . . . . . . . . . . . . . . . . . . . $49,503 $ (53,004) $
31,045
Non-Swiss . . . . . . . . . . . . . . . . . . . . . . . . . . . . . . . . . . . . . . . . . . . . . . . . . . 28,079 (200,324) 93,282
Income (loss) before taxes . . . . . . . . . . . . . . . . . . . . . . . . . . . . . . . . . . . $
77,582
$
(253,328
) $
124,327
(1) During fiscal year 2014, the Company determined that Swiss loss before taxes reported previously as
($121.8) million and ($65.2) million in fiscal years 2013 and 2012, respectively, was overstated by $71.0 million
in 2013 and $64.5 million in 2012 and Non-Swiss income (loss) before taxes previously reported as
($129.3) million and $157.8 million for 2013 and 2012 was understated by $71.0 million in 2013 and overstated
254