Logitech 2014 Annual Report Download - page 192
Download and view the complete annual report
Please find page 192 of the 2014 Logitech annual report below. You can navigate through the pages in the report by either clicking on the pages listed below, or by using the keyword search tool below to find specific information within the annual report.-
 1
1 -
2
-
3
-
4
-
5
-
6
-
7
-
8
-
9
-
10
-
11
-
12
-
13
-
14
-
15
-
16
-
17
-
18
-
19
-
20
-
21
-
22
-
23
-
24
-
25
-
26
-
27
-
28
-
29
-
30
-
31
-
32
-
33
-
34
-
35
-
36
-
37
-
38
-
39
-
40
-
41
-
42
-
43
-
44
-
45
-
46
-
47
-
48
-
49
-
50
-
51
-
52
-
53
-
54
-
55
-
56
-
57
-
58
-
59
-
60
-
61
-
62
-
63
-
64
-
65
-
66
-
67
-
68
-
69
-
70
-
71
-
72
-
73
-
74
-
75
-
76
-
77
-
78
-
79
-
80
-
81
-
82
-
83
-
84
-
85
-
86
-
87
-
88
-
89
-
90
-
91
-
92
-
93
-
94
-
95
-
96
-
97
-
98
-
99
-
100
-
101
-
102
-
103
-
104
-
105
-
106
-
107
-
108
-
109
-
110
-
111
-
112
-
113
-
114
-
115
-
116
-
117
-
118
-
119
-
120
-
121
-
122
-
123
-
124
-
125
-
126
-
127
-
128
-
129
-
130
-
131
-
132
-
133
-
134
-
135
-
136
-
137
-
138
-
139
-
140
-
141
-
142
-
143
-
144
-
145
-
146
-
147
-
148
-
149
-
150
-
151
-
152
-
153
-
154
-
155
-
156
-
157
-
158
-
159
-
160
-
161
-
162
-
163
-
164
-
165
-
166
-
167
-
168
-
169
-
170
-
171
-
172
-
173
-
174
-
175
-
176
-
177
-
178
-
179
-
180
-
181
-
 182
182 -
 183
183 -
 184
184 -
 185
185 -
 186
186 -
 187
187 -
 188
188 -
 189
189 -
 190
190 -
 191
191 -
 192
192 -
 193
193 -
 194
194 -
 195
195 -
 196
196 -
 197
197 -
 198
198 -
 199
199 -
 200
200 -
 201
201 -
 202
202 -
203
-
204
-
205
-
206
-
207
-
208
-
209
-
210
-
211
-
212
-
213
-
214
-
215
-
216
-
217
-
218
-
219
-
220
-
221
-
222
-
223
-
224
-
225
-
226
-
227
-
228
-
229
-
230
-
231
-
232
-
233
-
234
-
235
-
236
-
237
-
238
-
239
-
240
-
241
-
242
-
243
-
244
-
245
-
246
-
247
-
248
-
249
-
250
-
251
-
252
-
253
-
254
-
255
-
256
-
257
-
258
-
259
-
260
-
261
-
262
-
263
-
264
-
265
-
266
-
267
-
268
-
269
-
270
-
271
-
272
-
273
-
274
-
275
-
276
-
277
-
278
-
279
-
280
-
281
-
282
-
283
-
284
-
285
-
286
-
287
-
288
-
289
-
290
-
291
-
292
-
293
-
294
-
295
-
296
-
297
-
298
-
299
-
300
-
301
-
302
-
303
-
304
-
305
-
306
-
307
-
308
 |
 |

iPad specific keyboard products in limited distribution, with encouraging results during the quarter ended June 30,
2011. This new tablet accessories product line includes the Keyboard Case for iPad2 and the Tablet Keyboard for
iPad, with additional products planned for launch in future quarters.
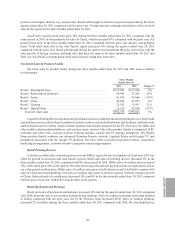
Retail Audio
Retail audio unit sales decreased 13% in the three months ended June 30, 2011 compared with the same period
in the prior year. Dollar sales growth in the Asia Pacific region was more than offset by declines in EMEA and
Americas. PC speaker sales decreased 12% in dollars and 5% in units. Sales of our iPod speakers decreased 15% in
dollars and 22% in units in the three months ended June 30, 2011 compared with the prior year. Partially offsetting
the sales declines in speakers, our Ultimate Ears line of earphones grew 12% in dollars during the quarter.
Retail Video
Our retail sales in the Video category increased 6%, while units decreased 9% in the quarter ended June 30,
2011 compared with 2010. The growth in sales was driven entirely by the Logitech Alert line of digital video
security systems. Webcam sales declined 7% in dollars and 10% in units in the three months ended June 30,
2011 compared with the same period in 2010, with growth in the Asia Pacific region offset by the sales decline in
Americas region.
Retail Gaming
Retail sales of our gaming peripherals grew 51%, while unit sales decreased 7% during the three months
ended June 30, 2011 compared with the same period in 2010. The dollar sales growth was due to strong sales of our
steering wheels. Steering wheels have a higher selling price than our other gaming products, which explains the
decline in unit sales. PC gaming sales increased 53% in dollars and decreased 4% in units during the three months
ended June 30, 2011 compared with the three months ended June 30, 2010. Console gaming sales increased 69% in
dollars and decreased 15% in units in the same periods.
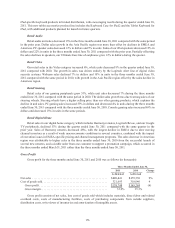
Retail Digital Home
Retail sales in our digital home category, which includes Harmony remotes, Logitech Revue, and our Google
TV peripherals, declined 53% during the quarter ended June 30, 2011 compared with the same quarter in the
prior year. Sales of Harmony remotes decreased 48%, with the largest decline in EMEA due to slow moving
channel inventory as a result of weak macroeconomic conditions in several countries, combined with the impact
of execution issues in EMEA-specific pricing and channel management programs. The sales decrease in Americas
region was attributable to higher sales in the three months ended June 30, 2010 from the successful launch of
several new remotes, and a sizable order from one customer to support a promotion campaign, which occurred in
the three months ended March 31, 2011 rather than the three months ended June 30, 2011.
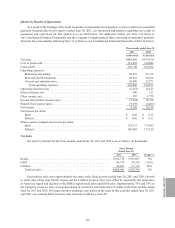
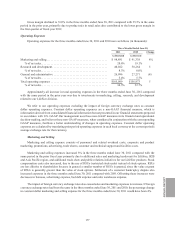
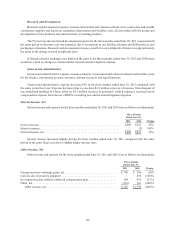
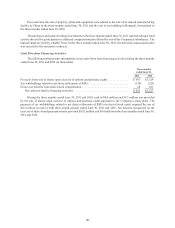
Gross Profit
Gross profit for the three months ended June 30, 2011 and 2010 was as follows (in thousands):
Three Months Ended June 30,
2011 2010 Change
As Restated As Revised
Net sales . . . . . . . . . . . . . . . . . . . . . . . . . . . . . . . . . . . . . . . . . . . . . . . . . . . . $480,441 $479,330 0%
Cost of goods sold . . . . . . . . . . . . . . . . . . . . . . . . . . . . . . . . . . . . . . . . . . . . . 321,693 310,046 4
Gross profit . . . . . . . . . . . . . . . . . . . . . . . . . . . . . . . . . . . . . . . . . . . . . . . $158,748 $169,284 (6)
Gross margin . . . . . . . . . . . . . . . . . . . . . . . . . . . . . . . . . . . . . . . . . . . . . . 33.0% 35.3%
Gross profit consists of net sales, less cost of goods sold which includes materials, direct labor and related
overhead costs, costs of manufacturing facilities, costs of purchasing components from outside suppliers,
distribution costs, write-down of inventories and amortization of intangible assets.
176