Logitech 2014 Annual Report Download - page 277
Download and view the complete annual report
Please find page 277 of the 2014 Logitech annual report below. You can navigate through the pages in the report by either clicking on the pages listed below, or by using the keyword search tool below to find specific information within the annual report.-
 1
1 -
2
-
3
-
4
-
5
-
6
-
7
-
8
-
9
-
10
-
11
-
12
-
13
-
14
-
15
-
16
-
17
-
18
-
19
-
20
-
21
-
22
-
23
-
24
-
25
-
26
-
27
-
28
-
29
-
30
-
31
-
32
-
33
-
34
-
35
-
36
-
37
-
38
-
39
-
40
-
41
-
42
-
43
-
44
-
45
-
46
-
47
-
48
-
49
-
50
-
51
-
52
-
53
-
54
-
55
-
56
-
57
-
58
-
59
-
60
-
61
-
62
-
63
-
64
-
65
-
66
-
67
-
68
-
69
-
70
-
71
-
72
-
73
-
74
-
75
-
76
-
77
-
78
-
79
-
80
-
81
-
82
-
83
-
84
-
85
-
86
-
87
-
88
-
89
-
90
-
91
-
92
-
93
-
94
-
95
-
96
-
97
-
98
-
99
-
100
-
101
-
102
-
103
-
104
-
105
-
106
-
107
-
108
-
109
-
110
-
111
-
112
-
113
-
114
-
115
-
116
-
117
-
118
-
119
-
120
-
121
-
122
-
123
-
124
-
125
-
126
-
127
-
128
-
129
-
130
-
131
-
132
-
133
-
134
-
135
-
136
-
137
-
138
-
139
-
140
-
141
-
142
-
143
-
144
-
145
-
146
-
147
-
148
-
149
-
150
-
151
-
152
-
153
-
154
-
155
-
156
-
157
-
158
-
159
-
160
-
161
-
162
-
163
-
164
-
165
-
166
-
167
-
168
-
169
-
170
-
171
-
172
-
173
-
174
-
175
-
176
-
177
-
178
-
179
-
180
-
181
-
182
-
183
-
184
-
185
-
186
-
187
-
188
-
189
-
190
-
191
-
192
-
193
-
194
-
195
-
196
-
197
-
198
-
199
-
200
-
201
-
202
-
203
-
204
-
205
-
206
-
207
-
208
-
209
-
210
-
211
-
212
-
213
-
214
-
215
-
216
-
217
-
218
-
219
-
220
-
221
-
222
-
223
-
224
-
225
-
226
-
227
-
228
-
229
-
230
-
231
-
232
-
233
-
234
-
235
-
236
-
237
-
238
-
239
-
240
-
241
-
242
-
243
-
244
-
245
-
246
-
247
-
248
-
249
-
250
-
251
-
252
-
253
-
254
-
255
-
256
-
257
-
258
-
259
-
260
-
261
-
262
-
263
-
264
-
265
-
266
-
 267
267 -
 268
268 -
 269
269 -
 270
270 -
 271
271 -
 272
272 -
 273
273 -
 274
274 -
 275
275 -
 276
276 -
 277
277 -
 278
278 -
 279
279 -
 280
280 -
 281
281 -
 282
282 -
 283
283 -
 284
284 -
 285
285 -
 286
286 -
 287
287 -
288
-
289
-
290
-
291
-
292
-
293
-
294
-
295
-
296
-
297
-
298
-
299
-
300
-
301
-
302
-
303
-
304
-
305
-
306
-
307
-
308
 |
 |

LOGITECH INTERNATIONAL S.A.
NOTES TO CONSOLIDATED FINANCIAL STATEMENTS (Continued)
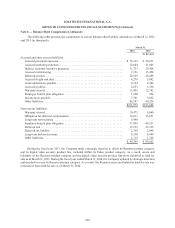
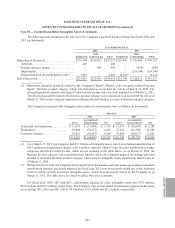
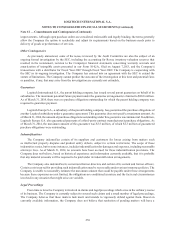
Note 8 — Balance Sheet Components (Continued)
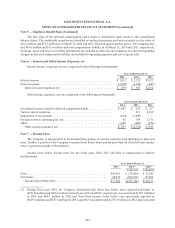
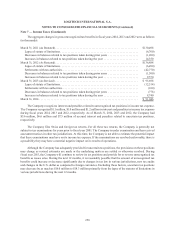
The following table presents the changes in the allowance for doubtful accounts during the fiscal years ended
March 31, 2014, 2013, and 2012 (in thousands):
Years Ended March 31,
2014 2013 2012
As Revised As Restated
Beginning of the period......................................... $ 2,153 $2,472 $ 4,086
Expense (reversal), net....................................... 656 (107) (592)
Write-offs, net of recoveries .................................. (1,097) (212) (1,022)
End of the period .............................................. $ 1,712 $2,153 $ 2,472
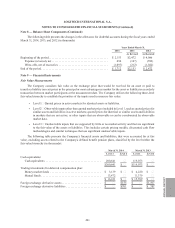
Note 9 — Financial Instruments
Fair Value Measurements
The Company considers fair value as the exchange price that would be received for an asset or paid to
transfer a liability (an exit price) in the principal or most advantageous market for the asset or liability in an orderly
transaction between market participants at the measurement date. The Company utilizes the following three-level
fair value hierarchy to establish the priorities of the inputs used to measure fair value:
• Level 1—Quoted prices in active markets for identical assets or liabilities.
• Level 2—Observable inputs other than quoted market prices included in Level 1, such as quoted prices for
similar assets and liabilities in active markets; quoted prices for identical or similar assets and liabilities
in markets that are not active; or other inputs that are observable or can be corroborated by observable
market data.
• Level 3—Unobservable inputs that are supported by little or no market activity and that are significant
to the fair value of the assets or liabilities. This includes certain pricing models, discounted cash flow
methodologies and similar techniques that use significant unobservable inputs.
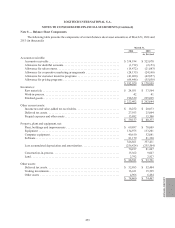
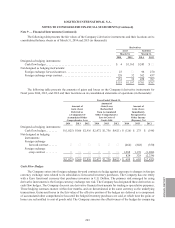
The following table presents the Company’s financial assets and liabilities, that were accounted for at fair
value, excluding assets related to the Company’s defined benefit pension plans, classified by the level within the
fair value hierarchy (in thousands):
March 31, 2014 March 31, 2013
Level 1 Level 2 Level 1 Level 2
Cash equivalents:
Cash equivalents ...................................... 200,641 — 119,073 —
$200,641 $ — $119,073 $ —
Trading investments for deferred compensation plan:
Money market funds ................................... $ 3,139 $ — $ 4,220 $ —
Mutual funds ......................................... 13,472 — 11,379 —
$ 16,611 $ — $ 15,599 $ —
Foreign exchange derivative assets ........................... $ — $155 $ — $1,197
Foreign exchange derivative liabilities ........................ $ — $701 $ — $ 707
ANNUAl REPORT
261