Logitech 2014 Annual Report Download - page 267
Download and view the complete annual report
Please find page 267 of the 2014 Logitech annual report below. You can navigate through the pages in the report by either clicking on the pages listed below, or by using the keyword search tool below to find specific information within the annual report.-
 1
1 -
2
-
3
-
4
-
5
-
6
-
7
-
8
-
9
-
10
-
11
-
12
-
13
-
14
-
15
-
16
-
17
-
18
-
19
-
20
-
21
-
22
-
23
-
24
-
25
-
26
-
27
-
28
-
29
-
30
-
31
-
32
-
33
-
34
-
35
-
36
-
37
-
38
-
39
-
40
-
41
-
42
-
43
-
44
-
45
-
46
-
47
-
48
-
49
-
50
-
51
-
52
-
53
-
54
-
55
-
56
-
57
-
58
-
59
-
60
-
61
-
62
-
63
-
64
-
65
-
66
-
67
-
68
-
69
-
70
-
71
-
72
-
73
-
74
-
75
-
76
-
77
-
78
-
79
-
80
-
81
-
82
-
83
-
84
-
85
-
86
-
87
-
88
-
89
-
90
-
91
-
92
-
93
-
94
-
95
-
96
-
97
-
98
-
99
-
100
-
101
-
102
-
103
-
104
-
105
-
106
-
107
-
108
-
109
-
110
-
111
-
112
-
113
-
114
-
115
-
116
-
117
-
118
-
119
-
120
-
121
-
122
-
123
-
124
-
125
-
126
-
127
-
128
-
129
-
130
-
131
-
132
-
133
-
134
-
135
-
136
-
137
-
138
-
139
-
140
-
141
-
142
-
143
-
144
-
145
-
146
-
147
-
148
-
149
-
150
-
151
-
152
-
153
-
154
-
155
-
156
-
157
-
158
-
159
-
160
-
161
-
162
-
163
-
164
-
165
-
166
-
167
-
168
-
169
-
170
-
171
-
172
-
173
-
174
-
175
-
176
-
177
-
178
-
179
-
180
-
181
-
182
-
183
-
184
-
185
-
186
-
187
-
188
-
189
-
190
-
191
-
192
-
193
-
194
-
195
-
196
-
197
-
198
-
199
-
200
-
201
-
202
-
203
-
204
-
205
-
206
-
207
-
208
-
209
-
210
-
211
-
212
-
213
-
214
-
215
-
216
-
217
-
218
-
219
-
220
-
221
-
222
-
223
-
224
-
225
-
226
-
227
-
228
-
229
-
230
-
231
-
232
-
233
-
234
-
235
-
236
-
237
-
238
-
239
-
240
-
241
-
242
-
243
-
244
-
245
-
246
-
247
-
248
-
249
-
250
-
251
-
252
-
253
-
254
-
255
-
256
-
 257
257 -
 258
258 -
 259
259 -
 260
260 -
 261
261 -
 262
262 -
 263
263 -
 264
264 -
 265
265 -
 266
266 -
 267
267 -
 268
268 -
 269
269 -
 270
270 -
 271
271 -
 272
272 -
 273
273 -
 274
274 -
 275
275 -
 276
276 -
 277
277 -
278
-
279
-
280
-
281
-
282
-
283
-
284
-
285
-
286
-
287
-
288
-
289
-
290
-
291
-
292
-
293
-
294
-
295
-
296
-
297
-
298
-
299
-
300
-
301
-
302
-
303
-
304
-
305
-
306
-
307
-
308
 |
 |

LOGITECH INTERNATIONAL S.A.
NOTES TO CONSOLIDATED FINANCIAL STATEMENTS (Continued)
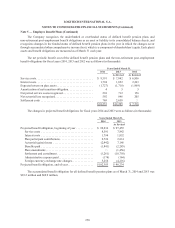
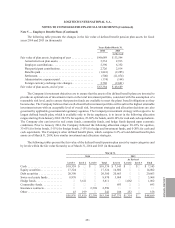
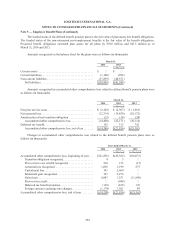
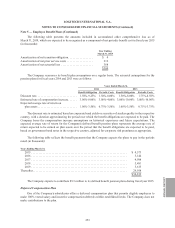
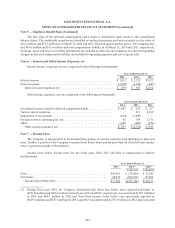
Note 5 — Employee Benefit Plans (Continued)
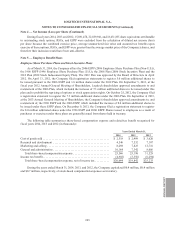
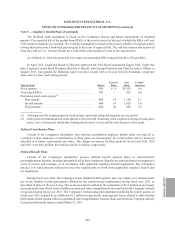
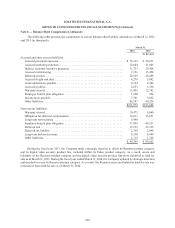
The following table presents the changes in the fair value of defined benefit pension plan assets for fiscal
years 2014 and 2013 (in thousands):
Years Ended March 31,
2014 2013
As Revised
Fair value of plan assets, beginning of year . . . . . . . . . . . . . . . $48,689 $ 53,594
Actual return on plan assets. . . . . . . . . . . . . . . . . . . . . . . . . 5,334 2,913
Employer contributions . . . . . . . . . . . . . . . . . . . . . . . . . . . . 5,390 6,352
Plan participant contributions . . . . . . . . . . . . . . . . . . . . . . . 2,726 2,814
Benefits paid . . . . . . . . . . . . . . . . . . . . . . . . . . . . . . . . . . . . (1,841) (2,285)
Settlement. . . . . . . . . . . . . . . . . . . . . . . . . . . . . . . . . . . . . . . (500) (11,874)
Administrative expenses paid . . . . . . . . . . . . . . . . . . . . . . . (174) (164)
Foreign currency exchange rate changes. . . . . . . . . . . . . . . 3,760 (2,661)
Fair value of plan assets, end of year. . . . . . . . . . . . . . . . . . . . . $63,384 $ 48,689
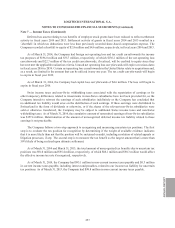
The Company’s investment objectives are to ensure that the assets of its defined benefit plans are invested to
provide an optimal rate of investment return on the total investment portfolio, consistent with the assumption of a
reasonable risk level, and to ensure that pension funds are available to meet the plans’ benefit obligations as they
become due. The Company believes that a well-diversified investment portfolio will result in the highest attainable
investment return with an acceptable level of overall risk. Investment strategies and allocation decisions are also
governed by applicable governmental regulatory agencies. The Company’s investment strategy with respect to its
largest defined benefit plan, which is available only to Swiss employees, is to invest in the following allocation
ranges starting from January 2014: 20-55% for equities, 25-60% for bonds, and 0-10% for cash and cash equivalents.
The Company also can invest in real estate funds, commodity funds, and hedge funds depend upon economic
conditions. Prior to January 2014, the Company followed the following allocation ranges: 28-43% for equities,
33-63% for Swiss bonds, 5-15% for foreign bonds, 5-15% for hedge and investment funds, and 0-20% for cash and
cash equivalents. The Company’s other defined benefit plans, which comprise 6.2% of total defined benefit plan
assets as of March 31, 2014, have similar investment and allocation strategies.
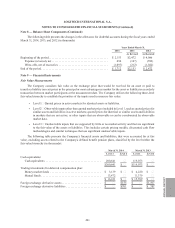
The following tables present the fair value of the defined benefit pension plan assets by major categories and
by levels within the fair value hierarchy as of March 31, 2014 and 2013 (in thousands):
March 31,
2014 2013
As Revised
Level 1 Level 2 Level 3 Total Level 1 Level 2 Level 3 Total
Cash . . . . . . . . . . . . . . . . . . . . . . . . $10,339 $ — $ — $10,339 $ 7,143 $ — $ — $ 7,143
Equity securities . . . . . . . . . . . . . . . 17,324 — — 17,324 14,802 — — 14,802
Debt securities . . . . . . . . . . . . . . . . 20,300 — — 20,300 20,663 — — 20,663
Swiss real estate funds . . . . . . . . . . 8,970 — — 8,970 3,968 — — 3,968
Hedge funds . . . . . . . . . . . . . . . . . . — 3,611 — 3,611 — 1,062 — 1,062
Commodity funds . . . . . . . . . . . . . . — — — — 693 — — 693
Insurance contracts . . . . . . . . . . . . . — — 2,598 2,598 — — — —
Other . . . . . . . . . . . . . . . . . . . . . . . . 43 199 — 242 106 252 — 358
$56,976 $3,810 $2,598 $63,384 $47,375 $1,314 $ — $48,689
ANNUAl REPORT
251