Logitech 2014 Annual Report Download - page 183
Download and view the complete annual report
Please find page 183 of the 2014 Logitech annual report below. You can navigate through the pages in the report by either clicking on the pages listed below, or by using the keyword search tool below to find specific information within the annual report.-
 1
1 -
2
-
3
-
4
-
5
-
6
-
7
-
8
-
9
-
10
-
11
-
12
-
13
-
14
-
15
-
16
-
17
-
18
-
19
-
20
-
21
-
22
-
23
-
24
-
25
-
26
-
27
-
28
-
29
-
30
-
31
-
32
-
33
-
34
-
35
-
36
-
37
-
38
-
39
-
40
-
41
-
42
-
43
-
44
-
45
-
46
-
47
-
48
-
49
-
50
-
51
-
52
-
53
-
54
-
55
-
56
-
57
-
58
-
59
-
60
-
61
-
62
-
63
-
64
-
65
-
66
-
67
-
68
-
69
-
70
-
71
-
72
-
73
-
74
-
75
-
76
-
77
-
78
-
79
-
80
-
81
-
82
-
83
-
84
-
85
-
86
-
87
-
88
-
89
-
90
-
91
-
92
-
93
-
94
-
95
-
96
-
97
-
98
-
99
-
100
-
101
-
102
-
103
-
104
-
105
-
106
-
107
-
108
-
109
-
110
-
111
-
112
-
113
-
114
-
115
-
116
-
117
-
118
-
119
-
120
-
121
-
122
-
123
-
124
-
125
-
126
-
127
-
128
-
129
-
130
-
131
-
132
-
133
-
134
-
135
-
136
-
137
-
138
-
139
-
140
-
141
-
142
-
143
-
144
-
145
-
146
-
147
-
148
-
149
-
150
-
151
-
152
-
153
-
154
-
155
-
156
-
157
-
158
-
159
-
160
-
161
-
162
-
163
-
164
-
165
-
166
-
167
-
168
-
169
-
170
-
171
-
172
-
 173
173 -
 174
174 -
 175
175 -
 176
176 -
 177
177 -
 178
178 -
 179
179 -
 180
180 -
 181
181 -
 182
182 -
 183
183 -
 184
184 -
 185
185 -
 186
186 -
 187
187 -
 188
188 -
 189
189 -
 190
190 -
 191
191 -
 192
192 -
 193
193 -
194
-
195
-
196
-
197
-
198
-
199
-
200
-
201
-
202
-
203
-
204
-
205
-
206
-
207
-
208
-
209
-
210
-
211
-
212
-
213
-
214
-
215
-
216
-
217
-
218
-
219
-
220
-
221
-
222
-
223
-
224
-
225
-
226
-
227
-
228
-
229
-
230
-
231
-
232
-
233
-
234
-
235
-
236
-
237
-
238
-
239
-
240
-
241
-
242
-
243
-
244
-
245
-
246
-
247
-
248
-
249
-
250
-
251
-
252
-
253
-
254
-
255
-
256
-
257
-
258
-
259
-
260
-
261
-
262
-
263
-
264
-
265
-
266
-
267
-
268
-
269
-
270
-
271
-
272
-
273
-
274
-
275
-
276
-
277
-
278
-
279
-
280
-
281
-
282
-
283
-
284
-
285
-
286
-
287
-
288
-
289
-
290
-
291
-
292
-
293
-
294
-
295
-
296
-
297
-
298
-
299
-
300
-
301
-
302
-
303
-
304
-
305
-
306
-
307
-
308
 |
 |

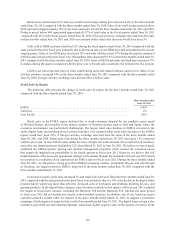
the significant improvement in our financial performance and outlook, we chose to terminate this Credit Facility
and wrote-off the capitalized commitment fees totaling $1.0 million. There were no outstanding borrowings at the
time of termination.
We had several uncommitted, unsecured bank lines of credit aggregating to $40.0 million as of March 31,
2014. There are no financial covenants under these lines of credit which we must comply with. As of March 31,
2014, we had outstanding bank guarantees of $7.1 million under these lines of credit. We also had credit lines
related to corporate credit cards totaling $6.9 million as of March 31, 2014. There are no financial covenants under
these credit lines.
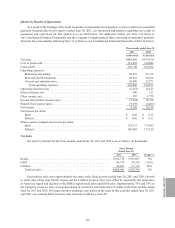
We file Swiss and foreign tax returns. For all these tax returns, we are generally not subject to tax examinations
for years prior to fiscal year 2001. We are under examination and have received assessment notices in foreign tax
jurisdictions. At this time, we are not able to estimate the potential impact that these examinations may have on
income tax expense. If the examinations are resolved unfavorably, there is a possibility they may have a material
negative impact on our results of operations.
Although we have adequately provided for uncertain tax positions, the provisions on these positions may
change as revised estimates are made or the underlying matters are settled or otherwise resolved. It is reasonably
possible that resolutions in the next 12 months could increase or decrease the balance of our unrecognized tax
benefits but we are not able to estimate the change at this time.
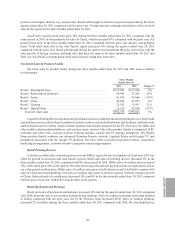
The following table summarizes our Consolidated Statements of Cash Flows (in thousands):
Years Ended March 31,
2014 2013 2012
As Revised As Restated
Net cash provided by operating activities . . . . . . . . . . . . . . . . . . . . . . . . $205,421 $ 122,389 $ 202,534
Net cash used in investing activities . . . . . . . . . . . . . . . . . . . . . . . . . . . . (46,803) (57,723) (57,602)
Net cash used in financing activities . . . . . . . . . . . . . . . . . . . . . . . . . . . . (22,681) (207,641) (139,374)
Effect of exchange rate changes on cash and cash equivalents . . . . . . . . (349) (1,571) (5,119)
Net increase (decrease) in cash and cash equivalents . . . . . . . . . . . . . . . $135,588 $(144,546) $ 439
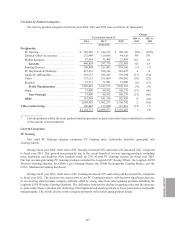
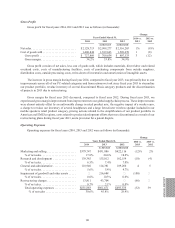
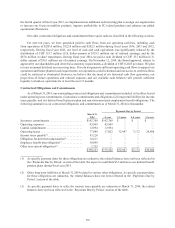
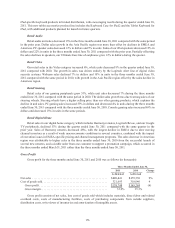
Cash Flow from Operating Activities
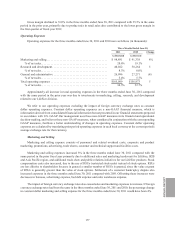
The following table presents selected financial information and statistics for fiscal years 2014, 2013 and 2012
(dollars in thousands):
March 31,
2014 2013 2012
As Revised As Restated
Accounts receivable, net . . . . . . . . . . . . . . . . . . . . . . . . . . . . . . . . . . . . . . . $182,029 $178,959 $223,104
Inventories . . . . . . . . . . . . . . . . . . . . . . . . . . . . . . . . . . . . . . . . . . . . . . . . . 222,402 262,644 297,072
Working capital . . . . . . . . . . . . . . . . . . . . . . . . . . . . . . . . . . . . . . . . . . . . . . 478,213 385,073 574,944
Days sales in accounts receivable (“DSO”)(1) . . . . . . . . . . . . . . . . . . . . . . . 34 days 34 days 38 days
Inventory turnover (“ITO”)(2) . . . . . . . . . . . . . . . . . . . . . . . . . . . . . . . . . . . 5.9x 4.7x 4.6x
(1) DSO is determined using ending accounts receivable as of the most recent quarter-end and net sales for the
most recent quarter.
(2) ITO is determined using ending inventories and annualized cost of goods sold (based on the most recent
quarterly cost of goods sold).
ANNUAl REPORT
167