Logitech 2012 Annual Report Download - page 240
Download and view the complete annual report
Please find page 240 of the 2012 Logitech annual report below. You can navigate through the pages in the report by either clicking on the pages listed below, or by using the keyword search tool below to find specific information within the annual report.-
 1
1 -
2
-
3
-
4
-
5
-
6
-
7
-
8
-
9
-
10
-
11
-
12
-
13
-
14
-
15
-
16
-
17
-
18
-
19
-
20
-
21
-
22
-
23
-
24
-
25
-
26
-
27
-
28
-
29
-
30
-
31
-
32
-
33
-
34
-
35
-
36
-
37
-
38
-
39
-
40
-
41
-
42
-
43
-
44
-
45
-
46
-
47
-
48
-
49
-
50
-
51
-
52
-
53
-
54
-
55
-
56
-
57
-
58
-
59
-
60
-
61
-
62
-
63
-
64
-
65
-
66
-
67
-
68
-
69
-
70
-
71
-
72
-
73
-
74
-
75
-
76
-
77
-
78
-
79
-
80
-
81
-
82
-
83
-
84
-
85
-
86
-
87
-
88
-
89
-
90
-
91
-
92
-
93
-
94
-
95
-
96
-
97
-
98
-
99
-
100
-
101
-
102
-
103
-
104
-
105
-
106
-
107
-
108
-
109
-
110
-
111
-
112
-
113
-
114
-
115
-
116
-
117
-
118
-
119
-
120
-
121
-
122
-
123
-
124
-
125
-
126
-
127
-
128
-
129
-
130
-
131
-
132
-
133
-
134
-
135
-
136
-
137
-
138
-
139
-
140
-
141
-
142
-
143
-
144
-
145
-
146
-
147
-
148
-
149
-
150
-
151
-
152
-
153
-
154
-
155
-
156
-
157
-
158
-
159
-
160
-
161
-
162
-
163
-
164
-
165
-
166
-
167
-
168
-
169
-
170
-
171
-
172
-
173
-
174
-
175
-
176
-
177
-
178
-
179
-
180
-
181
-
182
-
183
-
184
-
185
-
186
-
187
-
188
-
189
-
190
-
191
-
192
-
193
-
194
-
195
-
196
-
197
-
198
-
199
-
200
-
201
-
202
-
203
-
204
-
205
-
206
-
207
-
208
-
209
-
210
-
211
-
212
-
213
-
214
-
215
-
216
-
217
-
218
-
219
-
220
-
221
-
222
-
223
-
224
-
225
-
226
-
227
-
228
-
229
-
 230
230 -
 231
231 -
 232
232 -
 233
233 -
 234
234 -
 235
235 -
 236
236 -
 237
237 -
 238
238 -
 239
239 -
 240
240 -
 241
241 -
 242
242 -
 243
243 -
 244
244 -
 245
245 -
 246
246 -
 247
247 -
 248
248 -
 249
249 -
 250
250 -
251
-
252
-
253
-
254
-
255
-
256
-
257
-
258
-
259
-
260
-
261
-
262
-
263
-
264
-
265
-
266
-
267
-
268
-
269
-
270
-
271
-
272
-
273
-
274
-
275
-
276
-
277
-
278
-
279
-
280
-
281
-
282
-
283
-
284
-
285
-
286
-
287
-
288
-
289
-
290
-
291
-
292
 |
 |

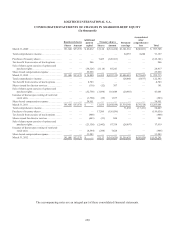
LOGITECH INTERNATIONAL S.A.
NOTES TO CONSOLIDATED FINANCIAL STATEMENTS (Continued)
Employee stock options, restricted stock units and similar share-based compensation awards granted by the
Company are treated as potential shares in computing diluted net income per share. Diluted shares outstanding
include the dilutive effect of in-the-money share-based awards which is calculated based on the average share
price for each fiscal period using the treasury stock method. Under the treasury stock method, the amount that the
employee must pay for exercising share-based awards, the amount of compensation cost for future service that the
Company has not yet recognized, and the amount of tax impact that would be recorded in additional paid-in capital
when the award becomes deductible are assumed to be used to repurchase shares.
During fiscal years 2012, 2011 and 2010, 18,431,855, 13,705,406 and 15,186,997 share equivalents attributable
to outstanding stock options and RSUs were excluded from the calculation of diluted net income per share because
the combined exercise price, average unamortized fair value and assumed tax benefits upon exercise of these
options and RSUs were greater than the average market price of the Company’s shares, and therefore their inclusion
would have been anti-dilutive.
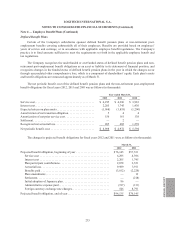
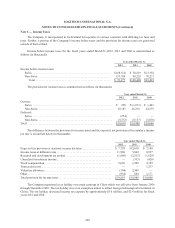
The following table illustrates the dilution effect of share-based awards granted, assumed and exercised
(in thousands):
Year ended March 31
2012 2011 2010
Basic weighted average shares outstanding as of March 31 . . . . . . . . . . . . . . 174,648 176,928 177,279
Stock options and RSUs granted . . . . . . . . . . . . . . . . . . . . . . . . . . . . . . . . . . . 3,012 2,431 3,902
Stock options and restricted stock assumed in LifeSize acquisition ........ — — 1,078
Stock options and RSUs canceled, forfeited, or expired . . . . . . . . . . . . . . . . . (3,820) (1,411) (1,440)
Net awards granted and assumed ................................... (808) 1,020 3,540
Grant dilution(1) ................................................. -0.5% 0.6% 2.0%
Stock options exercised and RSUs vested . . . . . . . . . . . . . . . . . . . . . . . . . . . . 715 2,889 1,980
Exercise dilution(2). . . . . . . . . . . . . . . . . . . . . . . . . . . . . . . . . . . . . . . . . . . . . . . 0.4% 1.6% 1.1%
(1) The percentage of grant dilution is computed based on net awards granted and assumed as a percentage of
basic weighted average shares outstanding.
(2) The percentage of exercise dilution is computed based on options exercised as a percentage of basic weighted
average shares outstanding.
Note 4 — Employee Benefit Plans
Employee Share Purchase Plans and Stock Incentive Plans
As of March 31, 2012, the Company offers the 2006 ESPP (2006 Employee Share Purchase Plan (Non-U.S.)),
the 1996 ESPP (1996 Employee Share Purchase Plan (U.S.)) and the 2006 Plan (2006 Stock Incentive Plan). On
April 13, 2012, the Company filed Registration Statements to register 5.0 million additional shares to be issued
pursuant to the 2006 Employee Share Purchase Plan (Non-U.S.), and 1.8 million shares under the 2012 Stock
Inducement Equity Plan approved by the Board of Directors in April 2012. Shares issued to employees as a result
of purchases or exercises under these plans are generally issued from shares held in treasury.
Note 3 — Net Income per Share (Continued)
230