Logitech 2012 Annual Report Download - page 202
Download and view the complete annual report
Please find page 202 of the 2012 Logitech annual report below. You can navigate through the pages in the report by either clicking on the pages listed below, or by using the keyword search tool below to find specific information within the annual report.-
 1
1 -
2
-
3
-
4
-
5
-
6
-
7
-
8
-
9
-
10
-
11
-
12
-
13
-
14
-
15
-
16
-
17
-
18
-
19
-
20
-
21
-
22
-
23
-
24
-
25
-
26
-
27
-
28
-
29
-
30
-
31
-
32
-
33
-
34
-
35
-
36
-
37
-
38
-
39
-
40
-
41
-
42
-
43
-
44
-
45
-
46
-
47
-
48
-
49
-
50
-
51
-
52
-
53
-
54
-
55
-
56
-
57
-
58
-
59
-
60
-
61
-
62
-
63
-
64
-
65
-
66
-
67
-
68
-
69
-
70
-
71
-
72
-
73
-
74
-
75
-
76
-
77
-
78
-
79
-
80
-
81
-
82
-
83
-
84
-
85
-
86
-
87
-
88
-
89
-
90
-
91
-
92
-
93
-
94
-
95
-
96
-
97
-
98
-
99
-
100
-
101
-
102
-
103
-
104
-
105
-
106
-
107
-
108
-
109
-
110
-
111
-
112
-
113
-
114
-
115
-
116
-
117
-
118
-
119
-
120
-
121
-
122
-
123
-
124
-
125
-
126
-
127
-
128
-
129
-
130
-
131
-
132
-
133
-
134
-
135
-
136
-
137
-
138
-
139
-
140
-
141
-
142
-
143
-
144
-
145
-
146
-
147
-
148
-
149
-
150
-
151
-
152
-
153
-
154
-
155
-
156
-
157
-
158
-
159
-
160
-
161
-
162
-
163
-
164
-
165
-
166
-
167
-
168
-
169
-
170
-
171
-
172
-
173
-
174
-
175
-
176
-
177
-
178
-
179
-
180
-
181
-
182
-
183
-
184
-
185
-
186
-
187
-
188
-
189
-
190
-
191
-
 192
192 -
 193
193 -
 194
194 -
 195
195 -
 196
196 -
 197
197 -
 198
198 -
 199
199 -
 200
200 -
 201
201 -
 202
202 -
 203
203 -
 204
204 -
 205
205 -
 206
206 -
 207
207 -
 208
208 -
 209
209 -
 210
210 -
 211
211 -
 212
212 -
213
-
214
-
215
-
216
-
217
-
218
-
219
-
220
-
221
-
222
-
223
-
224
-
225
-
226
-
227
-
228
-
229
-
230
-
231
-
232
-
233
-
234
-
235
-
236
-
237
-
238
-
239
-
240
-
241
-
242
-
243
-
244
-
245
-
246
-
247
-
248
-
249
-
250
-
251
-
252
-
253
-
254
-
255
-
256
-
257
-
258
-
259
-
260
-
261
-
262
-
263
-
264
-
265
-
266
-
267
-
268
-
269
-
270
-
271
-
272
-
273
-
274
-
275
-
276
-
277
-
278
-
279
-
280
-
281
-
282
-
283
-
284
-
285
-
286
-
287
-
288
-
289
-
290
-
291
-
292
 |
 |

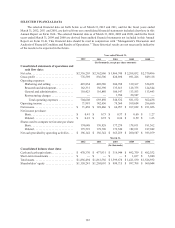
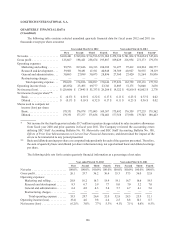
SELECTED FINANCIAL DATA
The selected financial data set forth below as of March 31, 2012 and 2011, and for the fiscal years ended
March 31, 2012, 2011 and 2010, are derived from our consolidated financial statements included elsewhere in this
Annual Report on Form 10-K. The selected financial data as of March 31, 2010, 2009 and 2008, and for the fiscal
years ended March 31, 2009 and 2008 are derived from audited financial statements not included in this Annual
Report on Form 10-K. This financial data should be read in conjunction with ‘‘Management’s Discussion and
Analysis of Financial Condition and Results of Operations.’’ These historical results are not necessarily indicative
of the results to be expected in the future.
Year ended March 31,
2012 2011 2010 2009 2008
(In thousands, except per share amounts)
Consolidated statements of operations and
cash flow data:
Net sales............................. $ 2,316,203 $ 2,362,886 $ 1,966,748 $ 2,208,832 $ 2,370,496
Gross profit .......................... 776,589 836,506 626,896 691,226 849,118
Operating expenses:
Marketing and selling ............... 423,854 420,580 304,788 319,167 324,451
Research and development............ 162,331 156,390 135,813 128,755 124,544
General and administrative ........... 118,423 116,880 106,147 113,103 113,443
Restructuring charges ............... — — 1,784 20,547 —
Total operating expenses .......... 704,608 693,850 548,532 581,572 562,438
Operating income ..................... 71,981 142,656 78,364 109,654 286,680
Net income........................... $ 71,458 $ 128,460 $ 64,957 $ 107,032 $ 231,026
Net income per share:
Basic ............................. $ 0.41 $ 0.73 $ 0.37 $ 0.60 $ 1.27
Diluted ........................... $ 0.41 $ 0.72 $ 0.36 $ 0.59 $ 1.23
Shares used to compute net income per share:
Basic ............................. 174,648 176,928 177,279 178,811 181,362
Diluted ........................... 175,591 178,790 179,340 182,911 187,942
Net cash provided by operating activities ... $ 196,142 $ 156,742 $ 365,259 $ 200,587 $ 393,079
March 31,
2012 2011 2010 2009 2008
(In thousands)
Consolidated balance sheet data:
Cash and cash equivalents ............... $ 478,370 $ 477,931 $ 319,944 $ 492,759 $ 482,352
Short-term investments . . . . . . . . . . . . . . . . . $ — $ — $ — $ 1,637 $ 3,940
Total assets........................... $1,856,494 $ 1,861,556 $ 1,599,678 $ 1,421,530 $ 1,526,932
Shareholders’ equity ................... $1,150,241 $ 1,205,001 $ 999,715 $ 997,708 $ 960,044
192