Logitech 2012 Annual Report Download - page 178
Download and view the complete annual report
Please find page 178 of the 2012 Logitech annual report below. You can navigate through the pages in the report by either clicking on the pages listed below, or by using the keyword search tool below to find specific information within the annual report.-
 1
1 -
2
-
3
-
4
-
5
-
6
-
7
-
8
-
9
-
10
-
11
-
12
-
13
-
14
-
15
-
16
-
17
-
18
-
19
-
20
-
21
-
22
-
23
-
24
-
25
-
26
-
27
-
28
-
29
-
30
-
31
-
32
-
33
-
34
-
35
-
36
-
37
-
38
-
39
-
40
-
41
-
42
-
43
-
44
-
45
-
46
-
47
-
48
-
49
-
50
-
51
-
52
-
53
-
54
-
55
-
56
-
57
-
58
-
59
-
60
-
61
-
62
-
63
-
64
-
65
-
66
-
67
-
68
-
69
-
70
-
71
-
72
-
73
-
74
-
75
-
76
-
77
-
78
-
79
-
80
-
81
-
82
-
83
-
84
-
85
-
86
-
87
-
88
-
89
-
90
-
91
-
92
-
93
-
94
-
95
-
96
-
97
-
98
-
99
-
100
-
101
-
102
-
103
-
104
-
105
-
106
-
107
-
108
-
109
-
110
-
111
-
112
-
113
-
114
-
115
-
116
-
117
-
118
-
119
-
120
-
121
-
122
-
123
-
124
-
125
-
126
-
127
-
128
-
129
-
130
-
131
-
132
-
133
-
134
-
135
-
136
-
137
-
138
-
139
-
140
-
141
-
142
-
143
-
144
-
145
-
146
-
147
-
148
-
149
-
150
-
151
-
152
-
153
-
154
-
155
-
156
-
157
-
158
-
159
-
160
-
161
-
162
-
163
-
164
-
165
-
166
-
167
-
 168
168 -
 169
169 -
 170
170 -
 171
171 -
 172
172 -
 173
173 -
 174
174 -
 175
175 -
 176
176 -
 177
177 -
 178
178 -
 179
179 -
 180
180 -
 181
181 -
 182
182 -
 183
183 -
 184
184 -
 185
185 -
 186
186 -
 187
187 -
 188
188 -
189
-
190
-
191
-
192
-
193
-
194
-
195
-
196
-
197
-
198
-
199
-
200
-
201
-
202
-
203
-
204
-
205
-
206
-
207
-
208
-
209
-
210
-
211
-
212
-
213
-
214
-
215
-
216
-
217
-
218
-
219
-
220
-
221
-
222
-
223
-
224
-
225
-
226
-
227
-
228
-
229
-
230
-
231
-
232
-
233
-
234
-
235
-
236
-
237
-
238
-
239
-
240
-
241
-
242
-
243
-
244
-
245
-
246
-
247
-
248
-
249
-
250
-
251
-
252
-
253
-
254
-
255
-
256
-
257
-
258
-
259
-
260
-
261
-
262
-
263
-
264
-
265
-
266
-
267
-
268
-
269
-
270
-
271
-
272
-
273
-
274
-
275
-
276
-
277
-
278
-
279
-
280
-
281
-
282
-
283
-
284
-
285
-
286
-
287
-
288
-
289
-
290
-
291
-
292
 |
 |

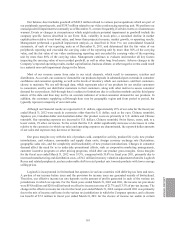
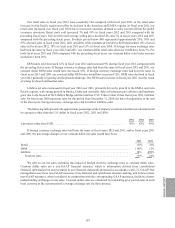
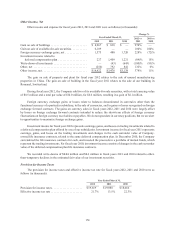
Retail Sales by Region
The following table presents the change in retail sales by region and the change in constant dollar retail sales
if foreign currency exchange rates had been the same in fiscal year 2012 compared with fiscal year 2011, and fiscal
year 2011 compared with fiscal year 2010:
2012 vs 2011 2011 vs 2010
Change in
Retail Units
Sold
Change in
Retail Sales
Change in
Constant Dollar
Retail Sales
Change in
Retail Units
Sold
Change in
Retail Sales
Change in
Constant Dollar
Retail Sales
Asia Pacific .............. 26%18%15%53%37%33%
Americas ................ (5)% (9)% (7)% 14%28%28%
EMEA .................. (3)% (2)% (4)% 9% (2)% 4%
Total retail sales ........ 3% (1)% (3)% 19%15%18%
Asia Pacific region achieved double-digit retail sales increases in all product families except Digital Home,
led by strong sales increases in pointing devices and keyboards/desktops. Retail sales in China increased 58% in
fiscal year 2012 compared with 2011, as a result of our increased investment in sales and marketing efforts in the
country. In fiscal year 2012, China was our third largest country in terms of net revenue. In fiscal year 2011, retail
sales in the Asia Pacific region increased in all product families compared with fiscal year 2010, also based on
strong sales in China. Retail sell-through in the Asia Pacific region increased 15% in fiscal year 2012 over 2011,
and grew 20% in fiscal year 2011 compared with 2010.
In the Americas region, retail sales for fiscal year 2012 compared with 2011 increased in keyboards/ desktops,
were flat in audio, and declined in all other product families, particularly Digital Home, Video and Pointing
Devices. Digital Home sales declined $14.3 million due to lower sales of Logitech Revue for Google TV, reflecting
our decision to lower the retail price of the product and not produce any more units. Retail sales for fiscal year 2011
increased in all product families compared with the preceding year. Retail sell-through in the Americas region
increased 2% in fiscal year 2012 over 2011, compared with 15% in fiscal year 2011 over 2010.
Retail sales in the EMEA region rebounded in the fourth quarter of fiscal year 2012, primarily due to improved
execution and management of programs with our channel partners. On a year to date basis, sales increased for
the keyboards/desktops and audio product families, and declined in Digital Home and Video. Retail sales in the
EMEA region decreased in most product families in fiscal year 2011 compared with 2010, as a result of the uneven
economic recovery, particularly in western Europe, and ineffective regional pricing and channel management
programs. Retail sell-through in the EMEA region increased 1% in fiscal year 2012 compared with a 12% increase
in fiscal year 2011.
We use retail sell-through data, which represents sales of our products by our retailer customers to consumers,
and by our distributor customers to their customers, along with other metrics, to assess consumer demand for our
products. Sell-through data is subject to limitations due to collection methods and the third party nature of the data
and thus may not be an accurate indicator of actual consumer demand for our products. In addition, the customers
supplying sell-through data vary by geographic region and from period to period, but typically represent a majority
of our retail sales.
168