Logitech 2012 Annual Report Download - page 184
Download and view the complete annual report
Please find page 184 of the 2012 Logitech annual report below. You can navigate through the pages in the report by either clicking on the pages listed below, or by using the keyword search tool below to find specific information within the annual report.-
 1
1 -
2
-
3
-
4
-
5
-
6
-
7
-
8
-
9
-
10
-
11
-
12
-
13
-
14
-
15
-
16
-
17
-
18
-
19
-
20
-
21
-
22
-
23
-
24
-
25
-
26
-
27
-
28
-
29
-
30
-
31
-
32
-
33
-
34
-
35
-
36
-
37
-
38
-
39
-
40
-
41
-
42
-
43
-
44
-
45
-
46
-
47
-
48
-
49
-
50
-
51
-
52
-
53
-
54
-
55
-
56
-
57
-
58
-
59
-
60
-
61
-
62
-
63
-
64
-
65
-
66
-
67
-
68
-
69
-
70
-
71
-
72
-
73
-
74
-
75
-
76
-
77
-
78
-
79
-
80
-
81
-
82
-
83
-
84
-
85
-
86
-
87
-
88
-
89
-
90
-
91
-
92
-
93
-
94
-
95
-
96
-
97
-
98
-
99
-
100
-
101
-
102
-
103
-
104
-
105
-
106
-
107
-
108
-
109
-
110
-
111
-
112
-
113
-
114
-
115
-
116
-
117
-
118
-
119
-
120
-
121
-
122
-
123
-
124
-
125
-
126
-
127
-
128
-
129
-
130
-
131
-
132
-
133
-
134
-
135
-
136
-
137
-
138
-
139
-
140
-
141
-
142
-
143
-
144
-
145
-
146
-
147
-
148
-
149
-
150
-
151
-
152
-
153
-
154
-
155
-
156
-
157
-
158
-
159
-
160
-
161
-
162
-
163
-
164
-
165
-
166
-
167
-
168
-
169
-
170
-
171
-
172
-
173
-
 174
174 -
 175
175 -
 176
176 -
 177
177 -
 178
178 -
 179
179 -
 180
180 -
 181
181 -
 182
182 -
 183
183 -
 184
184 -
 185
185 -
 186
186 -
 187
187 -
 188
188 -
 189
189 -
 190
190 -
 191
191 -
 192
192 -
 193
193 -
 194
194 -
195
-
196
-
197
-
198
-
199
-
200
-
201
-
202
-
203
-
204
-
205
-
206
-
207
-
208
-
209
-
210
-
211
-
212
-
213
-
214
-
215
-
216
-
217
-
218
-
219
-
220
-
221
-
222
-
223
-
224
-
225
-
226
-
227
-
228
-
229
-
230
-
231
-
232
-
233
-
234
-
235
-
236
-
237
-
238
-
239
-
240
-
241
-
242
-
243
-
244
-
245
-
246
-
247
-
248
-
249
-
250
-
251
-
252
-
253
-
254
-
255
-
256
-
257
-
258
-
259
-
260
-
261
-
262
-
263
-
264
-
265
-
266
-
267
-
268
-
269
-
270
-
271
-
272
-
273
-
274
-
275
-
276
-
277
-
278
-
279
-
280
-
281
-
282
-
283
-
284
-
285
-
286
-
287
-
288
-
289
-
290
-
291
-
292
 |
 |

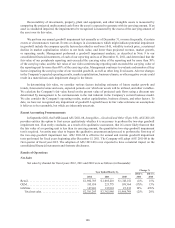
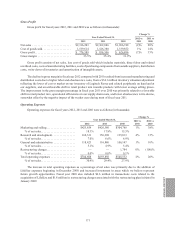
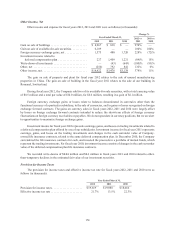
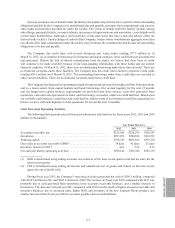
Other Income, Net
Other income and expense for fiscal years 2012, 2011 and 2010 were as follows (in thousands):
Year Ended March 31,
Change %
2012 vs
2011
2011 vs
20102012 2011 2010
Gain on sale of buildings . . . . . . . . . . . . . . . . . . . . . . . . . $ 8,967 $ 838 $ — 970% —
Gain on sale of available-for-sale securities ........... 6,109 — — 100% 100%
Foreign currency exchange gains, net . . . . . . . . . . . . . . . 1,575 480 1,720 228% (72)%
Investment income related to
deferred compensation plan . . . . . . . . . . . . . . . . . . . . 227 1,409 1,221 (84)% 15%
Write-down of investments . . . . . . . . . . . . . . . . . . . . . . . — (43) (643) (100)% (93)%
Other, net ..................................... (256) 792 841 132% 6%
Other income, net ............................... $16,622 $3,476 $3,139 378% 11%
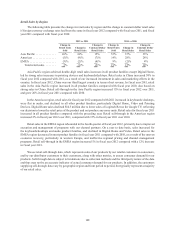
The gain on sale of property and plant for fiscal year 2012 relates to the sale of unused manufacturing
properties in China. The gain on sale of building in the fiscal year 2011 relates to the sale of our building in
Romanel, Switzerland.
During fiscal year 2012, the Company sold two of its available-for-sale securities, with a total carrying value
of $0.5 million and a total par value of $10.0 million, for $6.6 million, resulting in a gain of $6.1 million.
Foreign currency exchange gains or losses relate to balances denominated in currencies other than the
functional currency of a particular subsidiary, to the sale of currencies, and to gains or losses recognized on foreign
exchange forward contracts. The gains on currency sales in fiscal years 2012, 2011 and 2010 were largely offset
by losses on foreign exchange forward contracts intended to reduce the short-term effects of foreign currency
fluctuations on foreign currency receivables or payables. We do not speculate in currency positions, but we are alert
to opportunities to maximize foreign exchange gains.
Investment income for fiscal year 2012 represents earnings, gains, and losses on trading investments related to
a deferred compensation plan offered by one of our subsidiaries. Investment income for fiscal year 2011 represents
earnings, gains, and losses on the trading investments and changes in the cash surrender value of Company-
owned life insurance contracts, related to the same deferred compensation plan. In December 2010, the Company
surrendered the life insurance contracts for cash, and invested the proceeds in a portfolio of mutual funds, which
represent the trading investments. For fiscal year 2010, investment income consists of changes in the cash surrender
value of the deferred compensation plan life insurance contracts.
We recorded write-downs of $0.04 million and $0.6 million in fiscal years 2011 and 2010 related to other-
than-temporary declines in the estimated fair value of our investment securities.
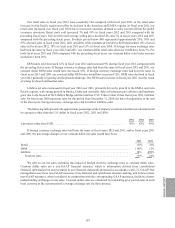
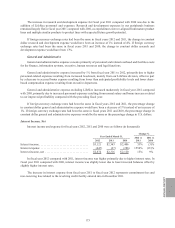
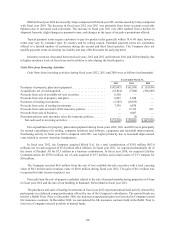
Provision for Income Taxes
The provision for income taxes and effective income tax rate for fiscal years 2012, 2011 and 2010 were as
follows (in thousands):
Year Ended March 31,
2012 2011 2010
Provision for income taxes ..................... $19,819 $19,988 $18,666
Effective income tax rate . . . . . . . . . . . . . . . . . . . . . . 21.7% 13.5% 22.3%
174