Logitech 2012 Annual Report Download - page 229
Download and view the complete annual report
Please find page 229 of the 2012 Logitech annual report below. You can navigate through the pages in the report by either clicking on the pages listed below, or by using the keyword search tool below to find specific information within the annual report.-
 1
1 -
2
-
3
-
4
-
5
-
6
-
7
-
8
-
9
-
10
-
11
-
12
-
13
-
14
-
15
-
16
-
17
-
18
-
19
-
20
-
21
-
22
-
23
-
24
-
25
-
26
-
27
-
28
-
29
-
30
-
31
-
32
-
33
-
34
-
35
-
36
-
37
-
38
-
39
-
40
-
41
-
42
-
43
-
44
-
45
-
46
-
47
-
48
-
49
-
50
-
51
-
52
-
53
-
54
-
55
-
56
-
57
-
58
-
59
-
60
-
61
-
62
-
63
-
64
-
65
-
66
-
67
-
68
-
69
-
70
-
71
-
72
-
73
-
74
-
75
-
76
-
77
-
78
-
79
-
80
-
81
-
82
-
83
-
84
-
85
-
86
-
87
-
88
-
89
-
90
-
91
-
92
-
93
-
94
-
95
-
96
-
97
-
98
-
99
-
100
-
101
-
102
-
103
-
104
-
105
-
106
-
107
-
108
-
109
-
110
-
111
-
112
-
113
-
114
-
115
-
116
-
117
-
118
-
119
-
120
-
121
-
122
-
123
-
124
-
125
-
126
-
127
-
128
-
129
-
130
-
131
-
132
-
133
-
134
-
135
-
136
-
137
-
138
-
139
-
140
-
141
-
142
-
143
-
144
-
145
-
146
-
147
-
148
-
149
-
150
-
151
-
152
-
153
-
154
-
155
-
156
-
157
-
158
-
159
-
160
-
161
-
162
-
163
-
164
-
165
-
166
-
167
-
168
-
169
-
170
-
171
-
172
-
173
-
174
-
175
-
176
-
177
-
178
-
179
-
180
-
181
-
182
-
183
-
184
-
185
-
186
-
187
-
188
-
189
-
190
-
191
-
192
-
193
-
194
-
195
-
196
-
197
-
198
-
199
-
200
-
201
-
202
-
203
-
204
-
205
-
206
-
207
-
208
-
209
-
210
-
211
-
212
-
213
-
214
-
215
-
216
-
217
-
218
-
 219
219 -
 220
220 -
 221
221 -
 222
222 -
 223
223 -
 224
224 -
 225
225 -
 226
226 -
 227
227 -
 228
228 -
 229
229 -
 230
230 -
 231
231 -
 232
232 -
 233
233 -
 234
234 -
 235
235 -
 236
236 -
 237
237 -
 238
238 -
 239
239 -
240
-
241
-
242
-
243
-
244
-
245
-
246
-
247
-
248
-
249
-
250
-
251
-
252
-
253
-
254
-
255
-
256
-
257
-
258
-
259
-
260
-
261
-
262
-
263
-
264
-
265
-
266
-
267
-
268
-
269
-
270
-
271
-
272
-
273
-
274
-
275
-
276
-
277
-
278
-
279
-
280
-
281
-
282
-
283
-
284
-
285
-
286
-
287
-
288
-
289
-
290
-
291
-
292
 |
 |

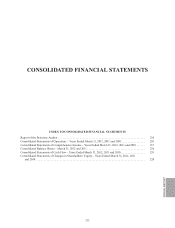
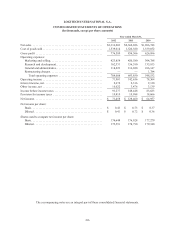
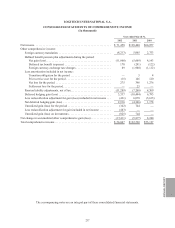
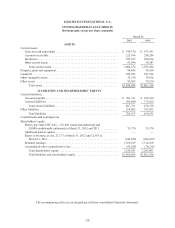
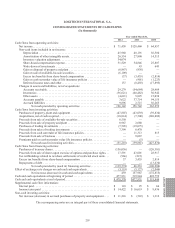
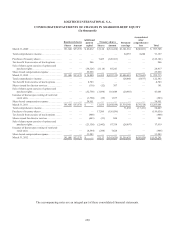
The accompanying notes are an integral part of these consolidated financial statements.
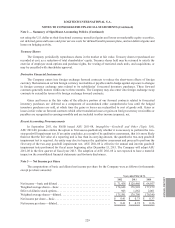
LOGITECH INTERNATIONAL S.A.
CONSOLIDATED STATEMENTS OF CASH FLOWS
(In thousands)
Year ended March 31,
2012 2011 2010
Cash flows from operating activities:
Net income . . . . . . . . . . . . . . . . . . . . . . . . . . . . . . . . . . . . . . . . . . . . . . . . . . . . . $ 71,458 $128,460 $ 64,957
Non-cash items included in net income:
Depreciation . . . . . . . . . . . . . . . . . . . . . . . . . . . . . . . . . . . . . . . . . . . . . . . . . 45,968 48,191 56,380
Amortization of other intangible assets . . . . . . . . . . . . . . . . . . . . . . . . . . . . 26,534 27,800 14,515
Inventory valuation adjustment . . . . . . . . . . . . . . . . . . . . . . . . . . . . . . . . . . 34,074 — —
Share-based compensation expense. . . . . . . . . . . . . . . . . . . . . . . . . . . . . . . 31,529 34,846 25,807
Write-down of investments . . . . . . . . . . . . . . . . . . . . . . . . . . . . . . . . . . . . . — 43 643
Gain on disposal of property and plant . . . . . . . . . . . . . . . . . . . . . . . . . . . . (8,967) (838) —
Gain on sale of available-for-sale securities. . . . . . . . . . . . . . . . . . . . . . . . . (6,109) — —
Excess tax benefits from share-based compensation . . . . . . . . . . . . . . . . . (37) (3,455) (2,814)
Gain on cash surrender value of life insurance policies . . . . . . . . . . . . . . . — (901) (1,223)
Deferred income taxes and other . . . . . . . . . . . . . . . . . . . . . . . . . . . . . . . . . 137 (8,492) (17,895)
Changes in assets and liabilities, net of acquisitions:
Accounts receivable . . . . . . . . . . . . . . . . . . . . . . . . . . . . . . . . . . . . . . . . . . . 29,279 (54,684) 28,489
Inventories . . . . . . . . . . . . . . . . . . . . . . . . . . . . . . . . . . . . . . . . . . . . . . . . . . (36,621) (60,482) 30,942
Other assets . . . . . . . . . . . . . . . . . . . . . . . . . . . . . . . . . . . . . . . . . . . . . . . . . (4,621) 5,825 15,038
Accounts payable . . . . . . . . . . . . . . . . . . . . . . . . . . . . . . . . . . . . . . . . . . . . . 3,622 37,714 94,155
Accrued liabilities . . . . . . . . . . . . . . . . . . . . . . . . . . . . . . . . . . . . . . . . . . . . 9,896 2,715 56,265
Net cash provided by operating activities. . . . . . . . . . . . . . . . . . . . . 196,142 156,742 365,259
Cash flows from investing activities:
Purchases of property, plant and equipment . . . . . . . . . . . . . . . . . . . . . . . . . . . (47,807) (43,039) (39,834)
Acquisitions, net of cash acquired . . . . . . . . . . . . . . . . . . . . . . . . . . . . . . . . . . . (18,814) (7,300) (388,809)
Proceeds from sale of available-for-sale securities . . . . . . . . . . . . . . . . . . . . . . 6,550 — —
Proceeds from sale of property and plant . . . . . . . . . . . . . . . . . . . . . . . . . . . . . 8,967 2,688 —
Purchases of trading investments . . . . . . . . . . . . . . . . . . . . . . . . . . . . . . . . . . . (7,505) (19,075) —
Proceeds from sales of trading investments . . . . . . . . . . . . . . . . . . . . . . . . . . . 7,399 6,470 —
Proceeds from cash surrender of life insurance policies. . . . . . . . . . . . . . . . . . — 11,313 813
Proceeds from sale of business . . . . . . . . . . . . . . . . . . . . . . . . . . . . . . . . . . . . . — 9,087 —
Premiums paid on cash surrender value life insurance policies . . . . . . . . . . . . — (5) —
Net cash used in investing activities. . . . . . . . . . . . . . . . . . . . . . . . . (51,210) (39,861) (427,830)
Cash flows from financing activities:
Purchases of treasury shares . . . . . . . . . . . . . . . . . . . . . . . . . . . . . . . . . . . . . . . (156,036) — (126,301)
Proceeds from sale of shares upon exercise of options and purchase rights. . . 17,591 43,001 28,917
Tax withholdings related to net share settlements of restricted stock units . . . (966) (223) —
Excess tax benefits from share-based compensation . . . . . . . . . . . . . . . . . . . . 37 3,455 2,814
Repayments of debt . . . . . . . . . . . . . . . . . . . . . . . . . . . . . . . . . . . . . . . . . . . . . . — — (13,630)
Net cash provided by (used in) financing activities . . . . . . . . . . . . . (139,374) 46,233 (108,200)
Effect of exchange rate changes on cash and cash equivalents. . . . . . . . . . . . . . . . (5,119) (5,127) (2,044)
Net increase (decrease) in cash and cash equivalents. . . . . . . . . . . . 439 157,987 (172,815)
Cash and cash equivalents at beginning of period . . . . . . . . . . . . . . . . . . . . . . . . . 477,931 319,944 492,759
Cash and cash equivalents at end of period. . . . . . . . . . . . . . . . . . . . . . . . . . . . . . . $ 478,370 $477,931 $ 319,944
Supplemental cash flow information:
Interest paid . . . . . . . . . . . . . . . . . . . . . . . . . . . . . . . . . . . . . . . . . . . . . . . . . . . . $ 110 $ 25 $ 66
Income taxes paid . . . . . . . . . . . . . . . . . . . . . . . . . . . . . . . . . . . . . . . . . . . . . . . $ 14,422 $ 16,619 $ 9,436
Non-cash investing activities:
Net increase (decrease) in accrued purchases of property and equipment . . . . $ 11,216 $ (522) $ 1,312
ANNUAL REPORT
219