Logitech 2012 Annual Report Download - page 181
Download and view the complete annual report
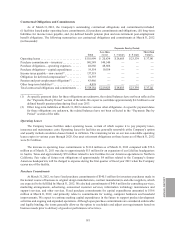
Please find page 181 of the 2012 Logitech annual report below. You can navigate through the pages in the report by either clicking on the pages listed below, or by using the keyword search tool below to find specific information within the annual report.-
 1
1 -
2
-
3
-
4
-
5
-
6
-
7
-
8
-
9
-
10
-
11
-
12
-
13
-
14
-
15
-
16
-
17
-
18
-
19
-
20
-
21
-
22
-
23
-
24
-
25
-
26
-
27
-
28
-
29
-
30
-
31
-
32
-
33
-
34
-
35
-
36
-
37
-
38
-
39
-
40
-
41
-
42
-
43
-
44
-
45
-
46
-
47
-
48
-
49
-
50
-
51
-
52
-
53
-
54
-
55
-
56
-
57
-
58
-
59
-
60
-
61
-
62
-
63
-
64
-
65
-
66
-
67
-
68
-
69
-
70
-
71
-
72
-
73
-
74
-
75
-
76
-
77
-
78
-
79
-
80
-
81
-
82
-
83
-
84
-
85
-
86
-
87
-
88
-
89
-
90
-
91
-
92
-
93
-
94
-
95
-
96
-
97
-
98
-
99
-
100
-
101
-
102
-
103
-
104
-
105
-
106
-
107
-
108
-
109
-
110
-
111
-
112
-
113
-
114
-
115
-
116
-
117
-
118
-
119
-
120
-
121
-
122
-
123
-
124
-
125
-
126
-
127
-
128
-
129
-
130
-
131
-
132
-
133
-
134
-
135
-
136
-
137
-
138
-
139
-
140
-
141
-
142
-
143
-
144
-
145
-
146
-
147
-
148
-
149
-
150
-
151
-
152
-
153
-
154
-
155
-
156
-
157
-
158
-
159
-
160
-
161
-
162
-
163
-
164
-
165
-
166
-
167
-
168
-
169
-
170
-
 171
171 -
 172
172 -
 173
173 -
 174
174 -
 175
175 -
 176
176 -
 177
177 -
 178
178 -
 179
179 -
 180
180 -
 181
181 -
 182
182 -
 183
183 -
 184
184 -
 185
185 -
 186
186 -
 187
187 -
 188
188 -
 189
189 -
 190
190 -
 191
191 -
192
-
193
-
194
-
195
-
196
-
197
-
198
-
199
-
200
-
201
-
202
-
203
-
204
-
205
-
206
-
207
-
208
-
209
-
210
-
211
-
212
-
213
-
214
-
215
-
216
-
217
-
218
-
219
-
220
-
221
-
222
-
223
-
224
-
225
-
226
-
227
-
228
-
229
-
230
-
231
-
232
-
233
-
234
-
235
-
236
-
237
-
238
-
239
-
240
-
241
-
242
-
243
-
244
-
245
-
246
-
247
-
248
-
249
-
250
-
251
-
252
-
253
-
254
-
255
-
256
-
257
-
258
-
259
-
260
-
261
-
262
-
263
-
264
-
265
-
266
-
267
-
268
-
269
-
270
-
271
-
272
-
273
-
274
-
275
-
276
-
277
-
278
-
279
-
280
-
281
-
282
-
283
-
284
-
285
-
286
-
287
-
288
-
289
-
290
-
291
-
292
 |
 |

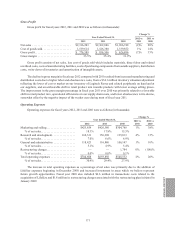
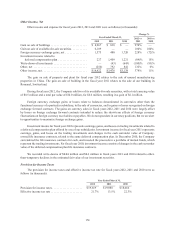
Gross Profit
Gross profit for fiscal years 2012, 2011 and 2010 was as follows (in thousands):
Year Ended March 31,
Change %
2012 vs
2011
2011 vs
20102012 2011 2010
Net sales . . . . . . . . . . . . . . . . . . . . . . . . . . . $2,316,203 $2,362,886 $1,966,748 (2)% 20%
Cost of goods sold .................... 1,539,614 1,526,380 1,339,852 1% 14%
Gross profit ......................... $ 776,589 $ 836,506 $ 626,896 (7)% 33%
Gross margin . . . . . . . . . . . . . . . . . . . . . . . 33.5% 35.4% 31.9%
Gross profit consists of net sales, less cost of goods sold which includes materials, direct labor and related
overhead costs, costs of manufacturing facilities, costs of purchasing components from outside suppliers, distribution
costs, write-down of inventories and amortization of intangible assets.
The decline in gross margin in fiscal year 2012 compared with 2011 resulted from increased manufacturing and
distribution costs due to higher labor and obsolescence costs, from a $34.1 million inventory valuation adjustment
reflecting the lower of cost or market on our inventory of Logitech Revue and related peripherals on hand and at
our suppliers, and an unfavorable shift in retail product mix towards products with lower average selling prices.
The improvement in the gross margin percentage in fiscal year 2011 over 2010 was primarily related to a favorable
shift in retail product mix, operational efficiencies in our supply chain costs, and lower obsolescence write-downs,
somewhat offset by the negative impact of the weaker euro during most of fiscal year 2011.
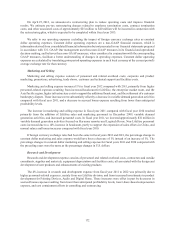
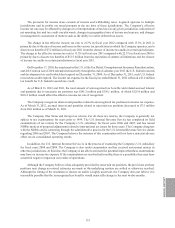
Operating Expenses
Operating expenses for fiscal years 2012, 2011 and 2010 were as follows (in thousands):
Year Ended March 31,
Change %
2012 vs
2011
2011 vs
20102012 2011 2010
Marketing and selling .................... $423,854 $420,580 $304,788 1% 38%
% of net sales ........................ 18.3% 17.8% 15.5%
Research and development ................ 162,331 156,390 135,813 4% 15%
% of net sales ........................ 7.0% 6.6% 6.9%
General and administrative . . . . . . . . . . . . . . . 118,423 116,880 106,147 1% 10%
% of net sales ........................ 5.1% 4.9% 5.4%
Restructuring charges .................... — — 1,784 0% (100)%
% of net sales ........................ 0.0% 0.0% 0.1%
Total operating expenses . . . . . . . . . . . . . . . . . $704,608 $693,850 $548,532 2% 26%
% of net sales ........................ 30.4% 29.4% 27.9%
The increase in total operating expenses as a percentage of net sales was primarily due to the addition of
LifeSize expenses beginning in December 2009, and increased investment in areas which we believe represent
future growth opportunities. Fiscal year 2010 also included $6.6 million in transactions costs related to the
acquisition of LifeSize and $1.8 million in restructuring charges associated with the restructuring plan initiated in
January 2009.
ANNUAL REPORT
171