Logitech 2012 Annual Report Download - page 133
Download and view the complete annual report
Please find page 133 of the 2012 Logitech annual report below. You can navigate through the pages in the report by either clicking on the pages listed below, or by using the keyword search tool below to find specific information within the annual report.-
 1
1 -
2
-
3
-
4
-
5
-
6
-
7
-
8
-
9
-
10
-
11
-
12
-
13
-
14
-
15
-
16
-
17
-
18
-
19
-
20
-
21
-
22
-
23
-
24
-
25
-
26
-
27
-
28
-
29
-
30
-
31
-
32
-
33
-
34
-
35
-
36
-
37
-
38
-
39
-
40
-
41
-
42
-
43
-
44
-
45
-
46
-
47
-
48
-
49
-
50
-
51
-
52
-
53
-
54
-
55
-
56
-
57
-
58
-
59
-
60
-
61
-
62
-
63
-
64
-
65
-
66
-
67
-
68
-
69
-
70
-
71
-
72
-
73
-
74
-
75
-
76
-
77
-
78
-
79
-
80
-
81
-
82
-
83
-
84
-
85
-
86
-
87
-
88
-
89
-
90
-
91
-
92
-
93
-
94
-
95
-
96
-
97
-
98
-
99
-
100
-
101
-
102
-
103
-
104
-
105
-
106
-
107
-
108
-
109
-
110
-
111
-
112
-
113
-
114
-
115
-
116
-
117
-
118
-
119
-
120
-
121
-
122
-
 123
123 -
 124
124 -
 125
125 -
 126
126 -
 127
127 -
 128
128 -
 129
129 -
 130
130 -
 131
131 -
 132
132 -
 133
133 -
 134
134 -
 135
135 -
 136
136 -
 137
137 -
 138
138 -
 139
139 -
 140
140 -
 141
141 -
 142
142 -
 143
143 -
144
-
145
-
146
-
147
-
148
-
149
-
150
-
151
-
152
-
153
-
154
-
155
-
156
-
157
-
158
-
159
-
160
-
161
-
162
-
163
-
164
-
165
-
166
-
167
-
168
-
169
-
170
-
171
-
172
-
173
-
174
-
175
-
176
-
177
-
178
-
179
-
180
-
181
-
182
-
183
-
184
-
185
-
186
-
187
-
188
-
189
-
190
-
191
-
192
-
193
-
194
-
195
-
196
-
197
-
198
-
199
-
200
-
201
-
202
-
203
-
204
-
205
-
206
-
207
-
208
-
209
-
210
-
211
-
212
-
213
-
214
-
215
-
216
-
217
-
218
-
219
-
220
-
221
-
222
-
223
-
224
-
225
-
226
-
227
-
228
-
229
-
230
-
231
-
232
-
233
-
234
-
235
-
236
-
237
-
238
-
239
-
240
-
241
-
242
-
243
-
244
-
245
-
246
-
247
-
248
-
249
-
250
-
251
-
252
-
253
-
254
-
255
-
256
-
257
-
258
-
259
-
260
-
261
-
262
-
263
-
264
-
265
-
266
-
267
-
268
-
269
-
270
-
271
-
272
-
273
-
274
-
275
-
276
-
277
-
278
-
279
-
280
-
281
-
282
-
283
-
284
-
285
-
286
-
287
-
288
-
289
-
290
-
291
-
292
 |
 |

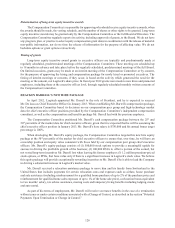
The Compensation Committee adopted the use of PSUs for executive officers during fiscal year 2009 in part
to align Logitech’s equity compensation for executives more closely with its compensation peer group, but most
importantly to further align the interests of executive officers with shareholders. The PSUs are intended to:
• Link compensation to key financial metrics of growth and profitability.
• Provide vesting based on Logitech’s stock price performance relative to a benchmark
(NASDAQ-100 Index).
• Require a relatively high standard for any vesting to occur, and provide an extraordinary payout if
Logitech’s performance significantly exceeds that of the benchmark group.
• Support pay-for-performance philosophy and retention efforts.
• Be less dilutive to shareholders than stock options.
The performance measure for the performance-based restricted stock units granted in fiscal years 2009 to
2012 is the relative total shareholder return, or TSR, expressed as a percentile rank, of Logitech shares against the
TSR of companies included in the NASDAQ-100 Index. The Compensation Committee believes this measure is
a key reflection of Logitech’s operational and financial performance, because it focuses on relative performance
against other mid- to large-size technology companies.
For purposes of the PSUs, relative TSR reflects (i) the aggregate change in the 30-day average closing
price of Logitech shares against the companies in the NASDAQ-100 Index, and (ii) the value (if any) returned to
shareholders in the form of dividends or similar distributions, assumed to be reinvested in shares when paid, each
at the beginning and the end of a three-year performance period (for grants made in fiscal year 2011 or later) or
two-year performance period (for grants made prior to fiscal year 2011).
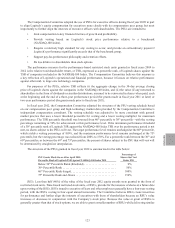
In fiscal year 2012, the Compensation Committee adjusted the structure of the PSU vesting schedule based
on our compensation peer group and high-technology market data provided by the Compensation Committee’s
independent compensation consultant. The vesting schedule was adjusted to be more consistent with general
market practice that uses a lower threshold percentile for vesting and a lower vesting multiplier for maximum
performance. The TSR percentile threshold was lowered from 40th percentile to 30th percentile - with the vesting
percentage remaining at 50% for achievement at this performance level. If the minimum performance threshold
of a 30th percentile rank of Logitech TSR against the NASDAQ-100 Index TSR over the performance period is not
met, no shares subject to the PSUs will vest. The target performance level remains unchanged at the 60th percentile,
which yields a vesting percentage of 100%, and the maximum performance level remains unchanged at the 75th
percentile, but the vesting percentage was reduced from 200% to 150%. For a percentile rank between the 30th and
60th percentiles, or between the 60th and 75th percentiles, the percent of shares subject to the PSU that will vest will
be determined by straight-line interpolation.
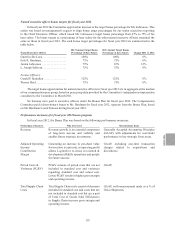
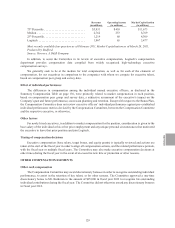
The structure of the PSUs granted in fiscal year 2012 is summarized in the table below:
PSU Grants Made On or After April 2011:
Percentile Rank of Logitech TSR Against NASDAQ-100 Index TSR
Percentage of
Shares that Vest
Under PSU
Below 30th Percentile Rank (threshold) . . . . . . . . . . . . . . . . . . . . . . 0%
30th Percentile Rank ..................................... 50%
60th Percentile Rank (target) ............................... 100%
75th Percentile Rank and Above . . . . . . . . . . . . . . . . . . . . . . . . . . . . 150%
RSUs. Less than half (40%) of the value of the fiscal year 2012 equity awards were granted in the form of
restricted stock units. Time-based restricted stock units, or RSUs, provide for the issuance of shares at a future date
upon vesting of the RSUs. RSUs issued to executive officers and other employees generally have a four-year vesting
period, with the RSUs vesting in four equal annual increments. The Committee believes RSUs create incentives
for performance and further align the interests of executives with those of shareholders because an RSU’s value
increases or decreases in conjunction with the Company’s stock price. Because the value at grant of RSUs is
generally greater than that of stock options, we are able to grant a smaller number of RSUs while delivering similar
ENGLISH
123