Logitech 2012 Annual Report Download - page 179
Download and view the complete annual report
Please find page 179 of the 2012 Logitech annual report below. You can navigate through the pages in the report by either clicking on the pages listed below, or by using the keyword search tool below to find specific information within the annual report.-
 1
1 -
2
-
3
-
4
-
5
-
6
-
7
-
8
-
9
-
10
-
11
-
12
-
13
-
14
-
15
-
16
-
17
-
18
-
19
-
20
-
21
-
22
-
23
-
24
-
25
-
26
-
27
-
28
-
29
-
30
-
31
-
32
-
33
-
34
-
35
-
36
-
37
-
38
-
39
-
40
-
41
-
42
-
43
-
44
-
45
-
46
-
47
-
48
-
49
-
50
-
51
-
52
-
53
-
54
-
55
-
56
-
57
-
58
-
59
-
60
-
61
-
62
-
63
-
64
-
65
-
66
-
67
-
68
-
69
-
70
-
71
-
72
-
73
-
74
-
75
-
76
-
77
-
78
-
79
-
80
-
81
-
82
-
83
-
84
-
85
-
86
-
87
-
88
-
89
-
90
-
91
-
92
-
93
-
94
-
95
-
96
-
97
-
98
-
99
-
100
-
101
-
102
-
103
-
104
-
105
-
106
-
107
-
108
-
109
-
110
-
111
-
112
-
113
-
114
-
115
-
116
-
117
-
118
-
119
-
120
-
121
-
122
-
123
-
124
-
125
-
126
-
127
-
128
-
129
-
130
-
131
-
132
-
133
-
134
-
135
-
136
-
137
-
138
-
139
-
140
-
141
-
142
-
143
-
144
-
145
-
146
-
147
-
148
-
149
-
150
-
151
-
152
-
153
-
154
-
155
-
156
-
157
-
158
-
159
-
160
-
161
-
162
-
163
-
164
-
165
-
166
-
167
-
168
-
 169
169 -
 170
170 -
 171
171 -
 172
172 -
 173
173 -
 174
174 -
 175
175 -
 176
176 -
 177
177 -
 178
178 -
 179
179 -
 180
180 -
 181
181 -
 182
182 -
 183
183 -
 184
184 -
 185
185 -
 186
186 -
 187
187 -
 188
188 -
 189
189 -
190
-
191
-
192
-
193
-
194
-
195
-
196
-
197
-
198
-
199
-
200
-
201
-
202
-
203
-
204
-
205
-
206
-
207
-
208
-
209
-
210
-
211
-
212
-
213
-
214
-
215
-
216
-
217
-
218
-
219
-
220
-
221
-
222
-
223
-
224
-
225
-
226
-
227
-
228
-
229
-
230
-
231
-
232
-
233
-
234
-
235
-
236
-
237
-
238
-
239
-
240
-
241
-
242
-
243
-
244
-
245
-
246
-
247
-
248
-
249
-
250
-
251
-
252
-
253
-
254
-
255
-
256
-
257
-
258
-
259
-
260
-
261
-
262
-
263
-
264
-
265
-
266
-
267
-
268
-
269
-
270
-
271
-
272
-
273
-
274
-
275
-
276
-
277
-
278
-
279
-
280
-
281
-
282
-
283
-
284
-
285
-
286
-
287
-
288
-
289
-
290
-
291
-
292
 |
 |

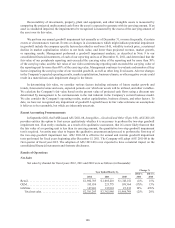
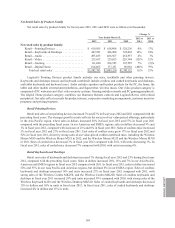
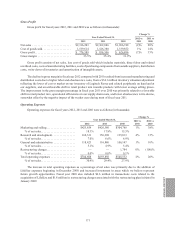
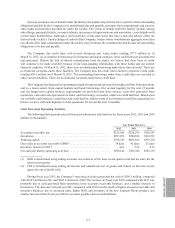
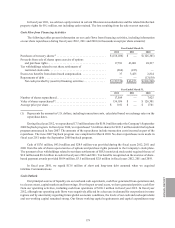
Net Retail Sales by Product Family
Net retail sales by product family for fiscal years 2012, 2011 and 2010 were as follows (in thousands):
Year Ended March 31,
Change %
2012 vs
2011
2011 vs
20102012 2011 2010
Net retail sales by product family:
Retail—Pointing Devices ................... $619,505 $618,404 $528,236 0% 17%
Retail—Keyboards & Desktops .............. 447,991 386,968 329,038 16%18%
Retail—Audio ............................ 483,485 466,927 454,957 4% 3%
Retail—Video............................. 215,657 255,015 228,344 (15)% 12%
Retail—Gaming .......................... 111,480 104,545 107,595 7% (3)%
Retail—Digital Home ...................... 104,665 173,351 96,982 (40)% 79%
Total net retail sales ..................... $1,982,783 $2,005,210 $1,745,152 (1)% 15%
Logitech’s Pointing Devices product family includes our mice, trackballs and other pointing devices.
Keyboards and desktops (mouse and keyboard combined) include cordless and corded keyboards and desktops,
and tablet keyboards and keyboard cases. Audio includes speakers and headset products for the PC, the home, the
tablet and other mobile entertainment platforms, and Squeezebox wireless music. Our video product category is
comprised of PC webcams and Alert video security systems. Gaming includes console and PC gaming peripherals.
The Digital Home product category combines our Harmony Remote controls and Logitech Revue with related
peripherals. Net sales reflect accruals for product returns, cooperative marketing arrangements, customer incentive
programs and pricing programs.
Retail Pointing Devices
Retail unit sales of our pointing devices increased 7% and 27% in fiscal years 2012 and 2011 compared with the
preceding fiscal years. The stronger growth in units reflects the success of our value-priced offerings, particularly
in the Asia Pacific region, where sales in dollars increased 20% in fiscal year 2012 and 57% in fiscal year 2011
compared with the preceding fiscal years. In our Americas and EMEA regions, sales in dollars decreased 9% and
1% in fiscal year 2012, compared with increases of 21% and 0% in fiscal year 2011. Sales of cordless mice increased
5% in fiscal year 2012 and 27% in fiscal year 2011. Unit sales of cordless mice grew 17% in fiscal year 2012 and
52% in fiscal year 2011, driven by strong sales of our value-priced cordless notebook mice, including the Wireless
Mouse M185 and the Wireless Mouse M315 in 2012, and the Wireless Mouse M215 and the Wireless Mouse M310
in 2011. Sales of corded mice decreased 7% in fiscal year 2012 compared with 2011, with units decreasing 3%. In
fiscal year 2011, sales of corded mice decreased 7% compared with 2010, with units increasing 6%.
Retail Keyboards and Desktops
Retail unit sales of keyboards and desktops increased 7% during fiscal year 2012 and 23% during fiscal year
2011, compared with the preceding fiscal years. Sales in dollars increased 28%, 16% and 7% in our Asia Pacific,
Americas and EMEA regions in fiscal year 2012 compared with 2011. In fiscal year 2011, sales in dollars increased
52% and 35% in our Asia Pacific and Americas regions, but declined 6% in our EMEA region. Sales of cordless
keyboards and desktops increased 14% and units increased 27% in fiscal year 2012 compared with 2011, with
strong sales of the Wireless Combo MK250, and the Wireless Combo MK220. Sales of cordless keyboards and
desktops in fiscal year 2011 increased 28% and units increased 39% compared with 2010, with strong sales of the
Wireless Keyboard K250 and the Wireless Desktop MK320. Sales of corded keyboards and desktops decreased
13% in dollars and 10% in units in fiscal year 2012. In fiscal year 2011, sales of corded keyboards and desktops
increased 4% in dollars and 15% in units.
ANNUAL REPORT
169