Logitech 2012 Annual Report Download - page 182
Download and view the complete annual report
Please find page 182 of the 2012 Logitech annual report below. You can navigate through the pages in the report by either clicking on the pages listed below, or by using the keyword search tool below to find specific information within the annual report.-
 1
1 -
2
-
3
-
4
-
5
-
6
-
7
-
8
-
9
-
10
-
11
-
12
-
13
-
14
-
15
-
16
-
17
-
18
-
19
-
20
-
21
-
22
-
23
-
24
-
25
-
26
-
27
-
28
-
29
-
30
-
31
-
32
-
33
-
34
-
35
-
36
-
37
-
38
-
39
-
40
-
41
-
42
-
43
-
44
-
45
-
46
-
47
-
48
-
49
-
50
-
51
-
52
-
53
-
54
-
55
-
56
-
57
-
58
-
59
-
60
-
61
-
62
-
63
-
64
-
65
-
66
-
67
-
68
-
69
-
70
-
71
-
72
-
73
-
74
-
75
-
76
-
77
-
78
-
79
-
80
-
81
-
82
-
83
-
84
-
85
-
86
-
87
-
88
-
89
-
90
-
91
-
92
-
93
-
94
-
95
-
96
-
97
-
98
-
99
-
100
-
101
-
102
-
103
-
104
-
105
-
106
-
107
-
108
-
109
-
110
-
111
-
112
-
113
-
114
-
115
-
116
-
117
-
118
-
119
-
120
-
121
-
122
-
123
-
124
-
125
-
126
-
127
-
128
-
129
-
130
-
131
-
132
-
133
-
134
-
135
-
136
-
137
-
138
-
139
-
140
-
141
-
142
-
143
-
144
-
145
-
146
-
147
-
148
-
149
-
150
-
151
-
152
-
153
-
154
-
155
-
156
-
157
-
158
-
159
-
160
-
161
-
162
-
163
-
164
-
165
-
166
-
167
-
168
-
169
-
170
-
171
-
 172
172 -
 173
173 -
 174
174 -
 175
175 -
 176
176 -
 177
177 -
 178
178 -
 179
179 -
 180
180 -
 181
181 -
 182
182 -
 183
183 -
 184
184 -
 185
185 -
 186
186 -
 187
187 -
 188
188 -
 189
189 -
 190
190 -
 191
191 -
 192
192 -
193
-
194
-
195
-
196
-
197
-
198
-
199
-
200
-
201
-
202
-
203
-
204
-
205
-
206
-
207
-
208
-
209
-
210
-
211
-
212
-
213
-
214
-
215
-
216
-
217
-
218
-
219
-
220
-
221
-
222
-
223
-
224
-
225
-
226
-
227
-
228
-
229
-
230
-
231
-
232
-
233
-
234
-
235
-
236
-
237
-
238
-
239
-
240
-
241
-
242
-
243
-
244
-
245
-
246
-
247
-
248
-
249
-
250
-
251
-
252
-
253
-
254
-
255
-
256
-
257
-
258
-
259
-
260
-
261
-
262
-
263
-
264
-
265
-
266
-
267
-
268
-
269
-
270
-
271
-
272
-
273
-
274
-
275
-
276
-
277
-
278
-
279
-
280
-
281
-
282
-
283
-
284
-
285
-
286
-
287
-
288
-
289
-
290
-
291
-
292
 |
 |
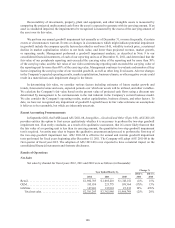
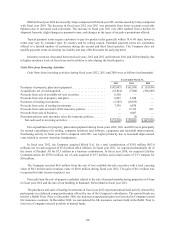
On April 25, 2012, we announced a restructuring plan to reduce operating costs and improve financial
results. We estimate pre-tax restructuring charges related to employee termination costs, contract termination
costs, and other associated costs of approximately $25 million to $40 million will be incurred in connection with
the restructuring plan, which is expected to be completed within fiscal year 2013.
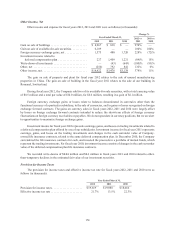
We refer to our operating expenses excluding the impact of foreign currency exchange rates as constant
dollar operating expenses. Constant dollar operating expenses are a non-GAAP financial measure, which is
information derived from consolidated financial information but not presented in our financial statements prepared
in accordance with U.S. GAAP. Our management uses these non-GAAP measures in its financial and operational
decision-making, and believes these non-GAAP measures, when considered in conjunction with the corresponding
GAAP measures, facilitate a better understanding of changes in operating expenses. Constant dollar operating
expenses are calculated by translating prior period operating expenses in each local currency at the current period’s
average exchange rate for that currency.
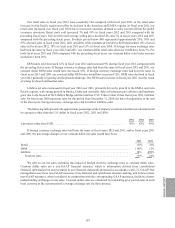
Marketing and Selling
Marketing and selling expense consists of personnel and related overhead costs, corporate and product
marketing, promotions, advertising, trade shows, customer and technical support and facilities costs.
Marketing and selling expense increased 1% in fiscal year 2012 compared with 2011, primarily from higher
personnel-related expenses resulting from increased headcount for LifeSize, the enterprise market team, and the
Asia Pacific region, higher infrastructure costs to support the additional headcount, and the settlement of a customer
bankruptcy dispute. These increases were substantially offset by a decrease in variable demand generation activities
compared with fiscal year 2011, and a decrease in accrued bonus expense resulting from lower than anticipated
profitability levels.
The increase in marketing and selling expense in fiscal year 2011 compared with fiscal year 2010 resulted
primarily from the addition of LifeSize sales and marketing personnel in December 2009, variable demand
generation activities, and increased personnel costs. In fiscal year 2011, we invested approximately $32 million in
variable demand generation activities focused on Harmony remotes and Logitech Revue. Non-LifeSize personnel
costs increased due to a 14% increase in headcount, partly to support the expansion of sales efforts in China, and
normal salary and bonus increases compared with fiscal year 2010.
If foreign currency exchange rates had been the same in fiscal years 2012 and 2011, the percentage change in
constant dollar marketing and sales expense would have been a decrease of 1% instead of an increase of 1%. The
percentage changes in constant dollar marketing and selling expense for fiscal years 2011 and 2010 compared with
the preceding years were the same as the percentage changes in U.S. dollars.
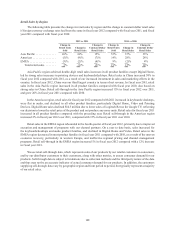
Research and Development
Research and development expense consists of personnel and related overhead costs, contractors and outside
consultants, supplies and materials, equipment depreciation and facilities costs, all associated with the design and
development of new products and enhancements of existing products.
The 4% increase in research and development expense from fiscal year 2011 to 2012 was primarily due to
higher personnel-related expenses, mainly from our LifeSize division, and from increased investments in product
development for Pointing Devices, Audio and Digital Home. These increases were offset in part by decreases in
accrued bonus expense resulting from lower than anticipated profitability levels, lower share-based compensation
expense, and cost containment efforts in consulting and outsourcing.
172