Logitech 2012 Annual Report Download - page 187
Download and view the complete annual report
Please find page 187 of the 2012 Logitech annual report below. You can navigate through the pages in the report by either clicking on the pages listed below, or by using the keyword search tool below to find specific information within the annual report.-
 1
1 -
2
-
3
-
4
-
5
-
6
-
7
-
8
-
9
-
10
-
11
-
12
-
13
-
14
-
15
-
16
-
17
-
18
-
19
-
20
-
21
-
22
-
23
-
24
-
25
-
26
-
27
-
28
-
29
-
30
-
31
-
32
-
33
-
34
-
35
-
36
-
37
-
38
-
39
-
40
-
41
-
42
-
43
-
44
-
45
-
46
-
47
-
48
-
49
-
50
-
51
-
52
-
53
-
54
-
55
-
56
-
57
-
58
-
59
-
60
-
61
-
62
-
63
-
64
-
65
-
66
-
67
-
68
-
69
-
70
-
71
-
72
-
73
-
74
-
75
-
76
-
77
-
78
-
79
-
80
-
81
-
82
-
83
-
84
-
85
-
86
-
87
-
88
-
89
-
90
-
91
-
92
-
93
-
94
-
95
-
96
-
97
-
98
-
99
-
100
-
101
-
102
-
103
-
104
-
105
-
106
-
107
-
108
-
109
-
110
-
111
-
112
-
113
-
114
-
115
-
116
-
117
-
118
-
119
-
120
-
121
-
122
-
123
-
124
-
125
-
126
-
127
-
128
-
129
-
130
-
131
-
132
-
133
-
134
-
135
-
136
-
137
-
138
-
139
-
140
-
141
-
142
-
143
-
144
-
145
-
146
-
147
-
148
-
149
-
150
-
151
-
152
-
153
-
154
-
155
-
156
-
157
-
158
-
159
-
160
-
161
-
162
-
163
-
164
-
165
-
166
-
167
-
168
-
169
-
170
-
171
-
172
-
173
-
174
-
175
-
176
-
 177
177 -
 178
178 -
 179
179 -
 180
180 -
 181
181 -
 182
182 -
 183
183 -
 184
184 -
 185
185 -
 186
186 -
 187
187 -
 188
188 -
 189
189 -
 190
190 -
 191
191 -
 192
192 -
 193
193 -
 194
194 -
 195
195 -
 196
196 -
 197
197 -
198
-
199
-
200
-
201
-
202
-
203
-
204
-
205
-
206
-
207
-
208
-
209
-
210
-
211
-
212
-
213
-
214
-
215
-
216
-
217
-
218
-
219
-
220
-
221
-
222
-
223
-
224
-
225
-
226
-
227
-
228
-
229
-
230
-
231
-
232
-
233
-
234
-
235
-
236
-
237
-
238
-
239
-
240
-
241
-
242
-
243
-
244
-
245
-
246
-
247
-
248
-
249
-
250
-
251
-
252
-
253
-
254
-
255
-
256
-
257
-
258
-
259
-
260
-
261
-
262
-
263
-
264
-
265
-
266
-
267
-
268
-
269
-
270
-
271
-
272
-
273
-
274
-
275
-
276
-
277
-
278
-
279
-
280
-
281
-
282
-
283
-
284
-
285
-
286
-
287
-
288
-
289
-
290
-
291
-
292
 |
 |

Upon an uncured event of default under the facility, the lenders may declare all or a portion of the outstanding
obligations payable by the Company to be immediately due and payable, terminate their commitments and exercise
other rights and remedies provided for under the facility. The events of default under the facility include, among
other things, payment defaults, covenant defaults, inaccuracy of representations and warranties, cross defaults with
certain other indebtedness, bankruptcy and insolvency events and events that have a material adverse effect (as
defined in the facility). Upon a change of control of the Company, lenders whose commitments aggregate more than
two-thirds of the total commitments under the facility may terminate the commitments and declare all outstanding
obligations to be due and payable.
The Company has credit lines with several European and Asian banks totaling $77.3 million as of
March 31, 2012. As is common for businesses in European and Asian countries, these credit lines are uncommitted
and unsecured. Despite the lack of formal commitments from the banks, we believe that these lines of credit
will continue to be made available because of our long-standing relationships with these banks and our current
financial condition. At March 31, 2012, there were no outstanding borrowings under these lines of credit. There are
no financial covenants under these facilities. The Company also has credit lines related to corporate credit cards
totaling $30.8 million as of March 31, 2012. The outstanding borrowings under these credit lines are recorded in
other current liabilities. There are no financial covenants under these credit lines.
The Company has financed its operating and capital requirements primarily through cash flow from operations
and, to a lesser extent, from capital markets and bank borrowings. Our normal liquidity for the next 12 months
and our longer-term capital resource requirements are provided from three sources: cash flow generated from
operations, cash and cash equivalents on hand, and borrowings, as needed, under our credit facilities. Based upon
our available cash balances, credit lines and credit facility, and the trend of our historical cash flow generation, we
believe we have sufficient liquidity to fund operations for at least the next 12 months.
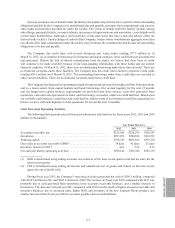
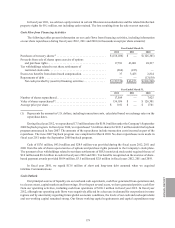
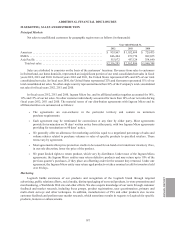
Cash Flow from Operating Activities
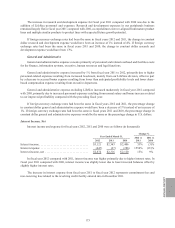
The following table presents selected financial information and statistics for fiscal years 2012, 2011 and 2010
(dollars in thousands):
Year Ended March 31,
2012 2011 2010
Accounts receivable, net . . . . . . . . . . . . . . . . . . . . . . . . . . . . . . . . . . . . . . . . . $223,104 $258,294 $195,247
Inventories . . . . . . . . . . . . . . . . . . . . . . . . . . . . . . . . . . . . . . . . . . . . . . . . . . . $297,072 $280,814 $219,593
Working capital . . . . . . . . . . . . . . . . . . . . . . . . . . . . . . . . . . . . . . . . . . . . . . . . $576,745 $605,666 $353,370
Days sales in accounts receivable (DSO)(1). . . . . . . . . . . . . . . . . . . . . . . . . . . 38 days 42 days 33 days
Inventory turnover (ITO)(2) . . . . . . . . . . . . . . . . . . . . . . . . . . . . . . . . . . . . . . . 4.6x 5.2x 6.1x
Net cash provided by operating activities . . . . . . . . . . . . . . . . . . . . . . . . . . . $196,142 $156,742 $365,259
(1) DSO is determined using ending accounts receivable as of the most recent quarter-end and net sales for the
most recent quarter.
(2) ITO is determined using ending inventories and annualized cost of goods sold (based on the most recent
quarterly cost of goods sold).
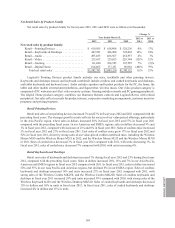
During fiscal year 2012, the Company’s operating activities generated net cash of $196.1 million, compared
with $156.7 million in 2011 and $365.3 million in 2009. The increase in fiscal year 2012 compared with 2011 was
primarily due to cash generated from operations, lower accounts receivable balances, and a smaller increase in
inventories. The decrease in fiscal year 2011 compared with 2010 was the result of higher accounts receivable and
inventory balances, due to increased sales, higher DSO, and inventory of the new Logitech Revue product, and
smaller increases than fiscal year 2010 in accounts payable and accrued liabilities.
ANNUAL REPORT
177