Logitech 2012 Annual Report Download - page 188
Download and view the complete annual report
Please find page 188 of the 2012 Logitech annual report below. You can navigate through the pages in the report by either clicking on the pages listed below, or by using the keyword search tool below to find specific information within the annual report.-
 1
1 -
2
-
3
-
4
-
5
-
6
-
7
-
8
-
9
-
10
-
11
-
12
-
13
-
14
-
15
-
16
-
17
-
18
-
19
-
20
-
21
-
22
-
23
-
24
-
25
-
26
-
27
-
28
-
29
-
30
-
31
-
32
-
33
-
34
-
35
-
36
-
37
-
38
-
39
-
40
-
41
-
42
-
43
-
44
-
45
-
46
-
47
-
48
-
49
-
50
-
51
-
52
-
53
-
54
-
55
-
56
-
57
-
58
-
59
-
60
-
61
-
62
-
63
-
64
-
65
-
66
-
67
-
68
-
69
-
70
-
71
-
72
-
73
-
74
-
75
-
76
-
77
-
78
-
79
-
80
-
81
-
82
-
83
-
84
-
85
-
86
-
87
-
88
-
89
-
90
-
91
-
92
-
93
-
94
-
95
-
96
-
97
-
98
-
99
-
100
-
101
-
102
-
103
-
104
-
105
-
106
-
107
-
108
-
109
-
110
-
111
-
112
-
113
-
114
-
115
-
116
-
117
-
118
-
119
-
120
-
121
-
122
-
123
-
124
-
125
-
126
-
127
-
128
-
129
-
130
-
131
-
132
-
133
-
134
-
135
-
136
-
137
-
138
-
139
-
140
-
141
-
142
-
143
-
144
-
145
-
146
-
147
-
148
-
149
-
150
-
151
-
152
-
153
-
154
-
155
-
156
-
157
-
158
-
159
-
160
-
161
-
162
-
163
-
164
-
165
-
166
-
167
-
168
-
169
-
170
-
171
-
172
-
173
-
174
-
175
-
176
-
177
-
 178
178 -
 179
179 -
 180
180 -
 181
181 -
 182
182 -
 183
183 -
 184
184 -
 185
185 -
 186
186 -
 187
187 -
 188
188 -
 189
189 -
 190
190 -
 191
191 -
 192
192 -
 193
193 -
 194
194 -
 195
195 -
 196
196 -
 197
197 -
 198
198 -
199
-
200
-
201
-
202
-
203
-
204
-
205
-
206
-
207
-
208
-
209
-
210
-
211
-
212
-
213
-
214
-
215
-
216
-
217
-
218
-
219
-
220
-
221
-
222
-
223
-
224
-
225
-
226
-
227
-
228
-
229
-
230
-
231
-
232
-
233
-
234
-
235
-
236
-
237
-
238
-
239
-
240
-
241
-
242
-
243
-
244
-
245
-
246
-
247
-
248
-
249
-
250
-
251
-
252
-
253
-
254
-
255
-
256
-
257
-
258
-
259
-
260
-
261
-
262
-
263
-
264
-
265
-
266
-
267
-
268
-
269
-
270
-
271
-
272
-
273
-
274
-
275
-
276
-
277
-
278
-
279
-
280
-
281
-
282
-
283
-
284
-
285
-
286
-
287
-
288
-
289
-
290
-
291
-
292
 |
 |

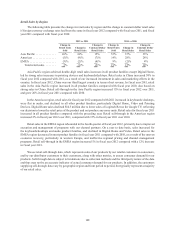
DSO for fiscal year 2012 decreased by 4 days compared with fiscal year 2011 and increased by 9 days compared
with fiscal year 2010. The decrease in fiscal year 2012 over 2011 was primarily from lower accounts receivable
balances due to increased cash collections. The increase in fiscal year 2011 over 2010 resulted from a decline in
shipment linearity, slight changes in payment terms, and changes in the types of incentive promotions offered.
Typical payment terms require customers to pay for product sales generally within 30 to 60 days; however,
terms may vary by customer type, by country and by selling season. Extended payment terms are sometimes
offered to a limited number of customers during the second and third fiscal quarters. The Company does not
modify payment terms on existing receivables, but may offer discounts for early payment.
Inventory turnover decreased between fiscal years 2012 and 2011 and between 2011 and 2010 primarily due
to higher inventory levels at fiscal year-end in relation to sales during the fourth quarter.
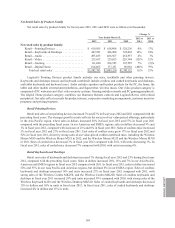
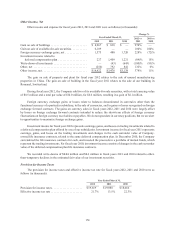
Cash Flow from Investing Activities
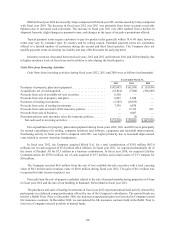
Cash flows from investing activities during fiscal years 2012, 2011 and 2010 were as follows (in thousands):
Year Ended March 31,
2012 2011 2010
Purchases of property, plant and equipment . . . . . . . . . . . . . . . . . . . . . . . $ (47,807) $ (43,039) $ (39,834)
Acquisitions, net of cash acquired. . . . . . . . . . . . . . . . . . . . . . . . . . . . . . . (18,814)(7,300)(388,809)
Proceeds from sale of available-for-sale securities . . . . . . . . . . . . . . . . . . 6,550 — —
Proceeds from sale of property and plant . . . . . . . . . . . . . . . . . . . . . . . . . 8,967 2,688 —
Purchases of trading investments . . . . . . . . . . . . . . . . . . . . . . . . . . . . . . . (7,505)(19,075) —
Proceeds from sales of trading investments . . . . . . . . . . . . . . . . . . . . . . . 7,399 6,470 —
Proceeds from cash surrender of life insurance policies . . . . . . . . . . . . . — 11,313 813
Proceeds from sale of business . . . . . . . . . . . . . . . . . . . . . . . . . . . . . . . . . — 9,087 —
Premiums paid on cash surrender value life insurance policies . . . . . . . . — (5) —
Net cash used in investing activities . . . . . . . . . . . . . . . . . . . . . . . . . . $ (51,210) $ (39,861) $ (427,830)
Our expenditures for property, plant and equipment during fiscal years 2012, 2011 and 2010 were principally
for normal expenditures for tooling, computer hardware and software, equipment and leasehold improvements.
Purchasing activity in fiscal year 2012 compared with 2011 was higher primarily due to leasehold improvement
costs related to our new Americas headquarters.
In fiscal year 2012, the Company acquired Mirial S.r.l. for a total consideration of $18.8 million (A13.0
million), net of cash acquired of $1.4 million (A1.0 million). In fiscal year 2011, we acquired substantially all of
the assets of Paradial AS for $7.3 million in a business combination. In fiscal year 2010, we acquired LifeSize
Communications for $378.6 million, net of cash acquired of $3.7 million, and certain assets of TV Compass for
$10 million.
The Company received $6.6 million from the sale of two available-for-sale securities with a total carrying
value of $0.5 million and a total par value of $10.0 million during fiscal year 2012. The gain of $6.1 million was
recognized in other income (expense), net.
Proceeds from the sale of property and plant related to the sale of unused manufacturing properties in China
in fiscal year 2012 and the sale of our building in Romanel, Switzerland in fiscal year 2011.
The purchases and sales of trading investments in fiscal year 2012 represent mutual fund activity directed by
participants in a deferred compensation plan offered by one of the Company’s subsidiaries. The mutual funds are
held by a Rabbi Trust. Prior to December 2010, the deferred compensation plan was invested in Company-owned
life insurance contracts. In December 2010, we surrendered the life insurance contracts held in the Rabbi Trust to
invest in a Company-selected portfolio of mutual funds.
178