Logitech 2012 Annual Report Download - page 206
Download and view the complete annual report
Please find page 206 of the 2012 Logitech annual report below. You can navigate through the pages in the report by either clicking on the pages listed below, or by using the keyword search tool below to find specific information within the annual report.-
 1
1 -
2
-
3
-
4
-
5
-
6
-
7
-
8
-
9
-
10
-
11
-
12
-
13
-
14
-
15
-
16
-
17
-
18
-
19
-
20
-
21
-
22
-
23
-
24
-
25
-
26
-
27
-
28
-
29
-
30
-
31
-
32
-
33
-
34
-
35
-
36
-
37
-
38
-
39
-
40
-
41
-
42
-
43
-
44
-
45
-
46
-
47
-
48
-
49
-
50
-
51
-
52
-
53
-
54
-
55
-
56
-
57
-
58
-
59
-
60
-
61
-
62
-
63
-
64
-
65
-
66
-
67
-
68
-
69
-
70
-
71
-
72
-
73
-
74
-
75
-
76
-
77
-
78
-
79
-
80
-
81
-
82
-
83
-
84
-
85
-
86
-
87
-
88
-
89
-
90
-
91
-
92
-
93
-
94
-
95
-
96
-
97
-
98
-
99
-
100
-
101
-
102
-
103
-
104
-
105
-
106
-
107
-
108
-
109
-
110
-
111
-
112
-
113
-
114
-
115
-
116
-
117
-
118
-
119
-
120
-
121
-
122
-
123
-
124
-
125
-
126
-
127
-
128
-
129
-
130
-
131
-
132
-
133
-
134
-
135
-
136
-
137
-
138
-
139
-
140
-
141
-
142
-
143
-
144
-
145
-
146
-
147
-
148
-
149
-
150
-
151
-
152
-
153
-
154
-
155
-
156
-
157
-
158
-
159
-
160
-
161
-
162
-
163
-
164
-
165
-
166
-
167
-
168
-
169
-
170
-
171
-
172
-
173
-
174
-
175
-
176
-
177
-
178
-
179
-
180
-
181
-
182
-
183
-
184
-
185
-
186
-
187
-
188
-
189
-
190
-
191
-
192
-
193
-
194
-
195
-
 196
196 -
 197
197 -
 198
198 -
 199
199 -
 200
200 -
 201
201 -
 202
202 -
 203
203 -
 204
204 -
 205
205 -
 206
206 -
 207
207 -
 208
208 -
 209
209 -
 210
210 -
 211
211 -
 212
212 -
 213
213 -
 214
214 -
 215
215 -
 216
216 -
217
-
218
-
219
-
220
-
221
-
222
-
223
-
224
-
225
-
226
-
227
-
228
-
229
-
230
-
231
-
232
-
233
-
234
-
235
-
236
-
237
-
238
-
239
-
240
-
241
-
242
-
243
-
244
-
245
-
246
-
247
-
248
-
249
-
250
-
251
-
252
-
253
-
254
-
255
-
256
-
257
-
258
-
259
-
260
-
261
-
262
-
263
-
264
-
265
-
266
-
267
-
268
-
269
-
270
-
271
-
272
-
273
-
274
-
275
-
276
-
277
-
278
-
279
-
280
-
281
-
282
-
283
-
284
-
285
-
286
-
287
-
288
-
289
-
290
-
291
-
292
 |
 |

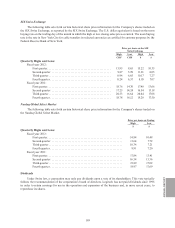
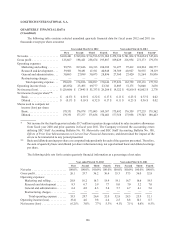
LOGITECH INTERNATIONAL S.A.
QUARTERLY FINANCIAL DATA
(Unaudited)
The following table contains selected unaudited quarterly financial data for fiscal years 2012 and 2011 (in
thousands except per share amounts):
Year ended March 31, 2012 Year ended March 31, 2011
First Second Third Fourth First Second Third Fourth*
Net sales..................... $480,441 $589,204 $714,596 $531,962 $479,330 $581,884 $754,054 $547,618
Gross profit .................. 125,607 198,421 258,674 193,887 169,029 216,934 271,173 179,370
Operating expenses:
Marketing and selling ....... 99,793 107,446 116,313 100,302 91,477 97,412 124,914 106,777
Research and development.... 39,981 39,491 41,911 40,948 38,389 40,927 38,955 38,119
General and administrative ... 30,865 27,989 30,673 28,896 27,360 27,420 31,264 30,836
Restructuring charges ....... — — — — — — — —
Total operating expense ... 170,639 174,926 188,897 170,146 157,226 165,759 195,133 175,732
Operating income (loss)......... (45,032)23,495 69,777 23,741 11,803 51,175 76,040 3,638
Net income (loss) .............. $(29,606) $ 17,445 $55,333 $28,286 $19,522 $41,160 $65,002 $2,776
Net income (loss) per share**:
Basic ..................... $(0.17) $ 0.10 $0.32 $0.17 $0.11 $0.23 $0.37 $0.02
Diluted ................... $(0.17) $ 0.10 $0.32 $0.17 $0.11 $0.23 $0.36 $0.02
Shares used to compute net
income (loss) per share:
Basic ..................... 179,331 176,878 173,003 169,387 175,492 176,359 177,233 178,562
Diluted ................... 179,331 177,277 173,656 170,401 177,358 177,958 179,703 180,423
* Net income for the fourth quarter includes $5.7 million in pretax charges related to sales incentive allowances
from fiscal year 2010 and prior quarters in fiscal year 2011. The Company reviewed the accounting errors
utilizing SEC Staff Accounting Bulletin No. 99, Materiality and SEC Staff Accounting Bulletin No. 108,
Effects of Prior Year Misstatements on Current Year Financial Statements, and determined the impact of the
errors to be immaterial to any period presented.
** Basic and diluted earnings per share are computed independently for each of the quarters presented. Therefore,
the sum of quarterly basic and diluted per share information may not equal annual basic and diluted earnings
per share.
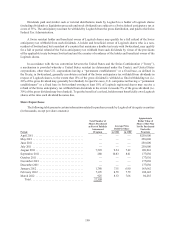
The following table sets forth certain quarterly financial information as a percentage of net sales:
Year ended March 31, 2012 Year ended March 31, 2011
First Second Third Fourth First Second Third Fourth
Net sales ........................ 100.0%100.0%100.0%100.0%100.0%100.0%100.0%100.0%
Gross profit ...................... 26.1 33.7 36.2 36.4 35.3 37.3 36.0 32.8
Operating expenses:
Marketing and selling ........... 20.8 18.2 16.3 18.9 19.1 16.7 16.6 19.5
Research and development . . . . . . . 8.3 6.7 5.9 7.7 8.0 7.0 5.2 7.0
General and administrative ....... 6.4 4.8 4.3 5.4 5.7 4.7 4.1 5.6
Restructuring charges ........... — — ——————
Total operating expense ...... 35.5 29.7 26.4 32.0 32.8 28.5 25.9 32.1
Operating income (loss) . . . . . . . . . . . . (9.4)4.0 9.8 4.4 2.5 8.8 10.1 0.7
Net income (loss) . . . . . . . . . . . . . . . . . (6.2)% 3.0%7.7%5.3%4.1%7.1%8.6%0.5%
196