Logitech 2012 Annual Report Download - page 169
Download and view the complete annual report
Please find page 169 of the 2012 Logitech annual report below. You can navigate through the pages in the report by either clicking on the pages listed below, or by using the keyword search tool below to find specific information within the annual report.-
 1
1 -
2
-
3
-
4
-
5
-
6
-
7
-
8
-
9
-
10
-
11
-
12
-
13
-
14
-
15
-
16
-
17
-
18
-
19
-
20
-
21
-
22
-
23
-
24
-
25
-
26
-
27
-
28
-
29
-
30
-
31
-
32
-
33
-
34
-
35
-
36
-
37
-
38
-
39
-
40
-
41
-
42
-
43
-
44
-
45
-
46
-
47
-
48
-
49
-
50
-
51
-
52
-
53
-
54
-
55
-
56
-
57
-
58
-
59
-
60
-
61
-
62
-
63
-
64
-
65
-
66
-
67
-
68
-
69
-
70
-
71
-
72
-
73
-
74
-
75
-
76
-
77
-
78
-
79
-
80
-
81
-
82
-
83
-
84
-
85
-
86
-
87
-
88
-
89
-
90
-
91
-
92
-
93
-
94
-
95
-
96
-
97
-
98
-
99
-
100
-
101
-
102
-
103
-
104
-
105
-
106
-
107
-
108
-
109
-
110
-
111
-
112
-
113
-
114
-
115
-
116
-
117
-
118
-
119
-
120
-
121
-
122
-
123
-
124
-
125
-
126
-
127
-
128
-
129
-
130
-
131
-
132
-
133
-
134
-
135
-
136
-
137
-
138
-
139
-
140
-
141
-
142
-
143
-
144
-
145
-
146
-
147
-
148
-
149
-
150
-
151
-
152
-
153
-
154
-
155
-
156
-
157
-
158
-
 159
159 -
 160
160 -
 161
161 -
 162
162 -
 163
163 -
 164
164 -
 165
165 -
 166
166 -
 167
167 -
 168
168 -
 169
169 -
 170
170 -
 171
171 -
 172
172 -
 173
173 -
 174
174 -
 175
175 -
 176
176 -
 177
177 -
 178
178 -
 179
179 -
180
-
181
-
182
-
183
-
184
-
185
-
186
-
187
-
188
-
189
-
190
-
191
-
192
-
193
-
194
-
195
-
196
-
197
-
198
-
199
-
200
-
201
-
202
-
203
-
204
-
205
-
206
-
207
-
208
-
209
-
210
-
211
-
212
-
213
-
214
-
215
-
216
-
217
-
218
-
219
-
220
-
221
-
222
-
223
-
224
-
225
-
226
-
227
-
228
-
229
-
230
-
231
-
232
-
233
-
234
-
235
-
236
-
237
-
238
-
239
-
240
-
241
-
242
-
243
-
244
-
245
-
246
-
247
-
248
-
249
-
250
-
251
-
252
-
253
-
254
-
255
-
256
-
257
-
258
-
259
-
260
-
261
-
262
-
263
-
264
-
265
-
266
-
267
-
268
-
269
-
270
-
271
-
272
-
273
-
274
-
275
-
276
-
277
-
278
-
279
-
280
-
281
-
282
-
283
-
284
-
285
-
286
-
287
-
288
-
289
-
290
-
291
-
292
 |
 |

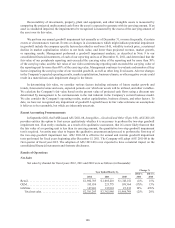
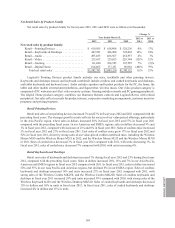
Retail sales in our Asia Pacific region increased 18% in fiscal year 2012 compared with fiscal year 2011.
China continued to be the single biggest driver in the region, with sales up by 58% in fiscal year 2012. Retail sales
in our Americas region decreased by 9%, due to lower sales from Logitech Revue and our Google TV peripherals,
which were impacted by the price drop implemented in our second fiscal quarter of 2012 and our exit from the
product line, and weak performance in the digital home and video categories. Lackluster economic conditions in
Western Europe and product gaps in our video and remotes product categories led to the decrease in EMEA retail
sales of 2% in fiscal year 2012. If foreign currency exchange rates had been the same in fiscal years 2012 and 2011,
the percentage changes in our constant dollar retail sales would have been an increase of 15% in Asia Pacific, a
decrease of 7% in the Americas, and a decrease of 4% in EMEA.
OEM sales decreased 17% in fiscal year 2012 compared with fiscal year 2011, and OEM units sold increased
1%, primarily due to increased pointing device sales.
Sales of LifeSize Communications products, which were 6% of total net sales in both fiscal years 2012 and
2011, increased by 10% in fiscal year 2012 compared with fiscal year 2011.
Our gross margin for fiscal year 2012 was 33.5% compared with 35.4% in the prior fiscal year, due to increased
manufacturing and distribution costs, a $34.1 million inventory valuation adjustment related to Logitech Revue and
related peripherals, and an unfavorable shift in retail product mix towards products with lower average selling
prices. Operating expenses for fiscal year 2012 were 30.4% of net sales compared with 29.4% in fiscal year 2011.
The increase in operating expenses was primarily due to the expansion of LifeSize, increased investment in areas of
future growth opportunities, such as China, and new product development, offset by lower advertising, marketing,
bonus and stock compensation expenses.
Net income for the year ended March 31, 2012 was $71.5 million, compared with net income of $128.5 million
in fiscal year 2011. The decline in net income was due to lower net sales, lower gross margin, and increased
operating expenses.
Trends in Our Business
Our sales of PC peripherals for use by consumers in the Americas and Europe have historically made up the
large majority of our revenues. We believe Logitech’s future sales growth will be determined by our ability to create
innovative products across all digital platforms, and our ability to increase sales in emerging markets, digital music,
products for enterprises, and LifeSize video conferencing.
The increasing popularity of smaller, mobile computing devices such as tablets and smartphones with touch
interfaces and the declining popularity of desktop PCs have rapidly changed the market and usage model for
PC peripherals. Logitech has begun to offer peripherals and accessories to augment the use of mobile devices.
For example, consumers are optimizing their audio experiences on their tablets and smartphones with premium
earphones and speakers that pair easily with their mobile devices. And they are enhancing their tablet experience
with a range of accessories and peripherals such as the Logitech Keyboard Case that enable them to create, consume
and share digital content more conveniently and comfortably. However, consumer acceptance and demand for our
products for tablets and other mobile devices is still developing.
In our traditional, mature markets, such as North America, Western and Nordic Europe, Japan, and Australia,
although the installed base of PC users is large, consumer demand for PCs and peripherals is slowing and potentially
may decline in future years. We believe there are continued growth opportunities for our PC peripherals outside
the more mature markets of the Americas and Europe. We have invested significantly in growing the number
of our sales, marketing and administrative personnel in China, with the result that China was our third-largest
country in retail sales for fiscal year 2012. We are also expanding our presence and our sales in Russia, India and
Latin America. We believe these markets offer high potential for us, but growing and conducting business in these
markets will continue to require significant investment and management focus, and our return on investment is not
ANNUAL REPORT
159