HSBC 2006 Annual Report Download - page 82
Download and view the complete annual report
Please find page 82 of the 2006 HSBC annual report below. You can navigate through the pages in the report by either clicking on the pages listed below, or by using the keyword search tool below to find specific information within the annual report.-
 1
1 -
 2
2 -
 3
3 -
 4
4 -
 5
5 -
 6
6 -
 7
7 -
 8
8 -
 9
9 -
 10
10 -
 11
11 -
 12
12 -
 13
13 -
 14
14 -
 15
15 -
 16
16 -
 17
17 -
 18
18 -
 19
19 -
 20
20 -
 21
21 -
 22
22 -
 23
23 -
 24
24 -
 25
25 -
 26
26 -
 27
27 -
 28
28 -
 29
29 -
 30
30 -
 31
31 -
 32
32 -
 33
33 -
 34
34 -
 35
35 -
 36
36 -
 37
37 -
 38
38 -
 39
39 -
 40
40 -
 41
41 -
 42
42 -
 43
43 -
 44
44 -
 45
45 -
 46
46 -
 47
47 -
 48
48 -
 49
49 -
 50
50 -
 51
51 -
 52
52 -
 53
53 -
 54
54 -
 55
55 -
 56
56 -
 57
57 -
 58
58 -
 59
59 -
 60
60 -
 61
61 -
 62
62 -
 63
63 -
 64
64 -
 65
65 -
 66
66 -
 67
67 -
 68
68 -
 69
69 -
 70
70 -
 71
71 -
 72
72 -
 73
73 -
 74
74 -
 75
75 -
 76
76 -
 77
77 -
 78
78 -
 79
79 -
 80
80 -
 81
81 -
 82
82 -
 83
83 -
 84
84 -
 85
85 -
 86
86 -
 87
87 -
 88
88 -
 89
89 -
 90
90 -
 91
91 -
 92
92 -
 93
93 -
 94
94 -
 95
95 -
 96
96 -
 97
97 -
 98
98 -
 99
99 -
 100
100 -
 101
101 -
 102
102 -
 103
103 -
 104
104 -
 105
105 -
 106
106 -
 107
107 -
 108
108 -
 109
109 -
 110
110 -
 111
111 -
 112
112 -
 113
113 -
 114
114 -
 115
115 -
 116
116 -
 117
117 -
 118
118 -
 119
119 -
 120
120 -
 121
121 -
 122
122 -
 123
123 -
 124
124 -
 125
125 -
 126
126 -
 127
127 -
 128
128 -
 129
129 -
 130
130 -
 131
131 -
 132
132 -
 133
133 -
 134
134 -
 135
135 -
 136
136 -
 137
137 -
 138
138 -
 139
139 -
 140
140 -
 141
141 -
 142
142 -
 143
143 -
 144
144 -
 145
145 -
 146
146 -
 147
147 -
 148
148 -
 149
149 -
 150
150 -
 151
151 -
 152
152 -
 153
153 -
 154
154 -
 155
155 -
 156
156 -
 157
157 -
 158
158 -
 159
159 -
 160
160 -
 161
161 -
 162
162 -
 163
163 -
 164
164 -
 165
165 -
 166
166 -
 167
167 -
 168
168 -
 169
169 -
 170
170 -
 171
171 -
 172
172 -
 173
173 -
 174
174 -
 175
175 -
 176
176 -
 177
177 -
 178
178 -
 179
179 -
 180
180 -
 181
181 -
 182
182 -
 183
183 -
 184
184 -
 185
185 -
 186
186 -
 187
187 -
 188
188 -
 189
189 -
 190
190 -
 191
191 -
 192
192 -
 193
193 -
 194
194 -
 195
195 -
 196
196 -
 197
197 -
 198
198 -
 199
199 -
 200
200 -
 201
201 -
 202
202 -
 203
203 -
 204
204 -
 205
205 -
 206
206 -
 207
207 -
 208
208 -
 209
209 -
 210
210 -
 211
211 -
 212
212 -
 213
213 -
 214
214 -
 215
215 -
 216
216 -
 217
217 -
 218
218 -
 219
219 -
 220
220 -
 221
221 -
 222
222 -
 223
223 -
 224
224 -
 225
225 -
 226
226 -
 227
227 -
 228
228 -
 229
229 -
 230
230 -
 231
231 -
 232
232 -
 233
233 -
 234
234 -
 235
235 -
 236
236 -
 237
237 -
 238
238 -
 239
239 -
 240
240 -
 241
241 -
 242
242 -
 243
243 -
 244
244 -
 245
245 -
 246
246 -
 247
247 -
 248
248 -
 249
249 -
 250
250 -
 251
251 -
 252
252 -
 253
253 -
 254
254 -
 255
255 -
 256
256 -
 257
257 -
 258
258 -
 259
259 -
 260
260 -
 261
261 -
 262
262 -
 263
263 -
 264
264 -
 265
265 -
 266
266 -
 267
267 -
 268
268 -
 269
269 -
 270
270 -
 271
271 -
 272
272 -
 273
273 -
 274
274 -
 275
275 -
 276
276 -
 277
277 -
 278
278 -
 279
279 -
 280
280 -
 281
281 -
 282
282 -
 283
283 -
 284
284 -
 285
285 -
 286
286 -
 287
287 -
 288
288 -
 289
289 -
 290
290 -
 291
291 -
 292
292 -
 293
293 -
 294
294 -
 295
295 -
 296
296 -
 297
297 -
 298
298 -
 299
299 -
 300
300 -
 301
301 -
 302
302 -
 303
303 -
 304
304 -
 305
305 -
 306
306 -
 307
307 -
 308
308 -
 309
309 -
 310
310 -
 311
311 -
 312
312 -
 313
313 -
 314
314 -
 315
315 -
 316
316 -
 317
317 -
 318
318 -
 319
319 -
 320
320 -
 321
321 -
 322
322 -
 323
323 -
 324
324 -
 325
325 -
 326
326 -
 327
327 -
 328
328 -
 329
329 -
 330
330 -
 331
331 -
 332
332 -
 333
333 -
 334
334 -
 335
335 -
 336
336 -
 337
337 -
 338
338 -
 339
339 -
 340
340 -
 341
341 -
 342
342 -
 343
343 -
 344
344 -
 345
345 -
 346
346 -
 347
347 -
 348
348 -
 349
349 -
 350
350 -
 351
351 -
 352
352 -
 353
353 -
 354
354 -
 355
355 -
 356
356 -
 357
357 -
 358
358 -
 359
359 -
 360
360 -
 361
361 -
 362
362 -
 363
363 -
 364
364 -
 365
365 -
 366
366 -
 367
367 -
 368
368 -
 369
369 -
 370
370 -
 371
371 -
 372
372 -
 373
373 -
 374
374 -
 375
375 -
 376
376 -
 377
377 -
 378
378 -
 379
379 -
 380
380 -
 381
381 -
 382
382 -
 383
383 -
 384
384 -
 385
385 -
 386
386 -
 387
387 -
 388
388 -
 389
389 -
 390
390 -
 391
391 -
 392
392 -
 393
393 -
 394
394 -
 395
395 -
 396
396 -
 397
397 -
 398
398 -
 399
399 -
 400
400 -
 401
401 -
 402
402 -
 403
403 -
 404
404 -
 405
405 -
 406
406 -
 407
407 -
 408
408 -
 409
409 -
 410
410 -
 411
411 -
 412
412 -
 413
413 -
 414
414 -
 415
415 -
 416
416 -
 417
417 -
 418
418 -
 419
419 -
 420
420 -
 421
421 -
 422
422 -
 423
423 -
 424
424 -
 425
425 -
 426
426 -
 427
427 -
 428
428 -
 429
429 -
 430
430 -
 431
431 -
 432
432 -
 433
433 -
 434
434 -
 435
435 -
 436
436 -
 437
437 -
 438
438 -
 439
439 -
 440
440 -
 441
441 -
 442
442 -
 443
443 -
 444
444 -
 445
445 -
 446
446 -
 447
447 -
 448
448 -
 449
449 -
 450
450 -
 451
451 -
 452
452 -
 453
453 -
 454
454 -
 455
455 -
 456
456 -
 457
457 -
 458
458
 |
 |

HSBC HOLDINGS PLC
Report of the Directors: Business Review (continued)
North America > 2006
80
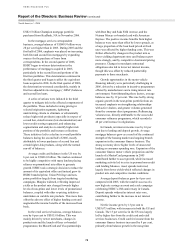
consequently higher in the second half of 2006 as
these portfolios seasoned, coinciding with the
weakening housing market.
In Canada, loan impairment charges were 38 per
cent higher. This primarily reflected the non-
recurrence of loan impairment releases from core
banking operations, which occurred in 2005, as well
as growth in both secured and unsecured lending
balances and higher delinquency rates in the motor
vehicle finance business.
Operating expenses grew by 12 per cent
to US$7,379 million. In the US, costs of
US$6,706 million were 11 per cent higher than in
2005. In the consumer finance business, the rise
was driven by increased headcount to support
incremental collections activity, and greater
volumes. Higher costs were incurred in marketing
cards to support the launch of new co-branded
credit cards, greater levels of mailing and other
promotional campaigns in the cards and retail
services businesses. IT and administrative expenses
grew in support of higher asset balances. A lower
level of deferred origination costs in the mortgage
services business, due to a decline in volumes,
contributed further to the cost growth.
In HSBC Bank USA, expense growth was
primarily driven by branch staff costs from
additional headcount recruited to support investment
in business expansion and new branch openings.
Greater emphasis placed on increasing the quality
and number of branch staff dedicated to sales and
customer relationship activities, which changed the
staff mix, also contributed to cost growth. The
continued promotion of the on-line savings product,
new branch openings and branding initiatives at the
John F. Kennedy International and LaGuardia
airports in New York led to a rise in marketing costs.
IT costs also grew following significant investment
expenditure incurred on several key network
efficiency projects.
In Canada, costs rose by 19 per cent, mainly due
to higher staff and marketing costs. Staff costs grew
by 13 per cent, with increased headcount supporting
expansion of the consumer finance business and
bank distribution network. Continuing investment in
growing the wealth management business and higher
incentive costs reflecting improved revenues also
contributed to the increase. Marketing costs grew
following external campaigns to improve brand
awareness.
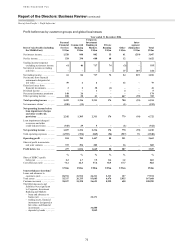
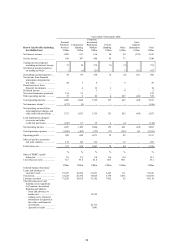
Commercial Banking’s pre-tax profits rose by
4 per cent to US$957 million, largely driven by
lending and deposit growth and higher fee income,
partly offset by increased loan impairment charges.
Costs rose mainly from geographical expansion in
the US and branch and business expansion in
Canada. The cost efficiency ratio worsened by
2.1 percentage points, as costs grew faster than
revenues.
Net interest income grew by 15 per cent to
US$1,362 million. In the US, net interest income
was 13 per cent higher, as HSBC continued to
expand its geographical presence, notably in Boston,
Connecticut, New Jersey, Philadelphia, Washington
D.C., Chicago and Los Angeles. Average deposit
balances rose by 30 per cent, aided by geographical
expansion and greater focus placed on generating
balances from commercial real estate companies and
middle market customers. In particular, there was an
increased emphasis on attracting high margin
balances from cash management sales activities.
Rising interest rates encouraged customers to
transfer funds to higher yielding products and the
resulting change in product mix led to a narrowing
of liability spreads.
The 7 per cent growth in average lending
balances was principally led by greater volumes
generated from small business and middle market
customers. This was achieved by a combination of
geographical expansion, increased marketing activity
and the recruitment of additional small-business
relationship managers. Asset spreads narrowed due
to competitive pricing pressures, particularly in the
middle market customer segment, which partly
offset the income benefits from higher lending
volumes.
In Canada, net interest income increased by
14 per cent. The strong economy encouraged
continued business investment by customers and
this, in conjunction with HSBC’s reputation for
customer service and relationship management,
helped generate a 15 per cent growth in average
lending balances. Loan spreads were broadly in line
with 2005. There was a 35 per cent improvement in
average deposit balances, driven by various factors
including the acquisition of new customers,
strengthening relationships with existing ones, and
enhancing payment and cash management products.
Deposit spreads widened as interest rates rose,
augmenting the income benefits from higher
balances.
Net interest income in Bermuda grew by
42 per cent, partly due to interest rate rises which
widened deposit spreads. Deposit balances increased
by 26 per cent, while increased cross-sales activity
contributed to a 26 per cent rise in average lending
balances.
