HSBC 2006 Annual Report Download - page 6
Download and view the complete annual report
Please find page 6 of the 2006 HSBC annual report below. You can navigate through the pages in the report by either clicking on the pages listed below, or by using the keyword search tool below to find specific information within the annual report.-
 1
1 -
 2
2 -
 3
3 -
 4
4 -
 5
5 -
 6
6 -
 7
7 -
 8
8 -
 9
9 -
 10
10 -
 11
11 -
 12
12 -
 13
13 -
 14
14 -
 15
15 -
 16
16 -
 17
17 -
18
-
19
-
20
-
21
-
22
-
23
-
24
-
25
-
26
-
27
-
28
-
29
-
30
-
31
-
32
-
33
-
34
-
35
-
36
-
37
-
38
-
39
-
40
-
41
-
42
-
43
-
44
-
45
-
46
-
47
-
48
-
49
-
50
-
51
-
52
-
53
-
54
-
55
-
56
-
57
-
58
-
59
-
60
-
61
-
62
-
63
-
64
-
65
-
66
-
67
-
68
-
69
-
70
-
71
-
72
-
73
-
74
-
75
-
76
-
77
-
78
-
79
-
80
-
81
-
82
-
83
-
84
-
85
-
86
-
87
-
88
-
89
-
90
-
91
-
92
-
93
-
94
-
95
-
96
-
97
-
98
-
99
-
100
-
101
-
102
-
103
-
104
-
105
-
106
-
107
-
108
-
109
-
110
-
111
-
112
-
113
-
114
-
115
-
116
-
117
-
118
-
119
-
120
-
121
-
122
-
123
-
124
-
125
-
126
-
127
-
128
-
129
-
130
-
131
-
132
-
133
-
134
-
135
-
136
-
137
-
138
-
139
-
140
-
141
-
142
-
143
-
144
-
145
-
146
-
147
-
148
-
149
-
150
-
151
-
152
-
153
-
154
-
155
-
156
-
157
-
158
-
159
-
160
-
161
-
162
-
163
-
164
-
165
-
166
-
167
-
168
-
169
-
170
-
171
-
172
-
173
-
174
-
175
-
176
-
177
-
178
-
179
-
180
-
181
-
182
-
183
-
184
-
185
-
186
-
187
-
188
-
189
-
190
-
191
-
192
-
193
-
194
-
195
-
196
-
197
-
198
-
199
-
200
-
201
-
202
-
203
-
204
-
205
-
206
-
207
-
208
-
209
-
210
-
211
-
212
-
213
-
214
-
215
-
216
-
217
-
218
-
219
-
220
-
221
-
222
-
223
-
224
-
225
-
226
-
227
-
228
-
229
-
230
-
231
-
232
-
233
-
234
-
235
-
236
-
237
-
238
-
239
-
240
-
241
-
242
-
243
-
244
-
245
-
246
-
247
-
248
-
249
-
250
-
251
-
252
-
253
-
254
-
255
-
256
-
257
-
258
-
259
-
260
-
261
-
262
-
263
-
264
-
265
-
266
-
267
-
268
-
269
-
270
-
271
-
272
-
273
-
274
-
275
-
276
-
277
-
278
-
279
-
280
-
281
-
282
-
283
-
284
-
285
-
286
-
287
-
288
-
289
-
290
-
291
-
292
-
293
-
294
-
295
-
296
-
297
-
298
-
299
-
300
-
301
-
302
-
303
-
304
-
305
-
306
-
307
-
308
-
309
-
310
-
311
-
312
-
313
-
314
-
315
-
316
-
317
-
318
-
319
-
320
-
321
-
322
-
323
-
324
-
325
-
326
-
327
-
328
-
329
-
330
-
331
-
332
-
333
-
334
-
335
-
336
-
337
-
338
-
339
-
340
-
341
-
342
-
343
-
344
-
345
-
346
-
347
-
348
-
349
-
350
-
351
-
352
-
353
-
354
-
355
-
356
-
357
-
358
-
359
-
360
-
361
-
362
-
363
-
364
-
365
-
366
-
367
-
368
-
369
-
370
-
371
-
372
-
373
-
374
-
375
-
376
-
377
-
378
-
379
-
380
-
381
-
382
-
383
-
384
-
385
-
386
-
387
-
388
-
389
-
390
-
391
-
392
-
393
-
394
-
395
-
396
-
397
-
398
-
399
-
400
-
401
-
402
-
403
-
404
-
405
-
406
-
407
-
408
-
409
-
410
-
411
-
412
-
413
-
414
-
415
-
416
-
417
-
418
-
419
-
420
-
421
-
422
-
423
-
424
-
425
-
426
-
427
-
428
-
429
-
430
-
431
-
432
-
433
-
434
-
435
-
436
-
437
-
438
-
439
-
440
-
441
-
442
-
443
-
444
-
445
-
446
-
447
-
448
-
449
-
450
-
451
-
452
-
453
-
454
-
455
-
456
-
457
-
458
 |
 |

HSBC HOLDINGS PLC
Financial Highlights (continued)
5-year comparison / Cautionary statement
4
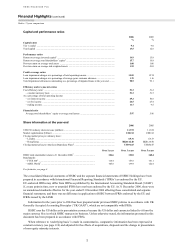
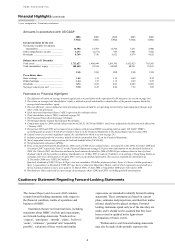
Amounts in accordance with US GAAP
2006 2005 2004 2003 2002
US$m US$m US$m US$m US$m
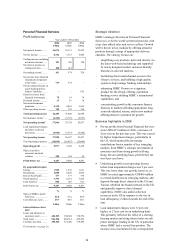
Income statement for the year
Net income available for ordinary
shareholders .......................................... 16,358 14,703 12,506 7,231 4,900
Other comprehensive income ................... 3,133 (7,271) 983 7,401 5,502
Dividends .................................................. 8,769 7,750 6,932 6,974 4,632
Balance sheet at 31 December
Total assets ................................................ 1,712,627 1,406,944 1,266,365 1,012,023 763,565
Total shareholders’ equity ........................ 108,540 93,524 90,082 80,251 55,831
US$ US$ US$ US$ US$
Per ordinary share
Basic earnings ........................................... 1.45 1.33 1.15 0.69 0.52
Diluted earnings ........................................ 1.44 1.32 1.13 0.69 0.52
Dividends .................................................. 0.76 0.69 0.63 0.685 0.495
Net asset value at year end ....................... 9.38 8.25 8.06 7.32 5.89
Footnotes to ‘Financial Highlights’
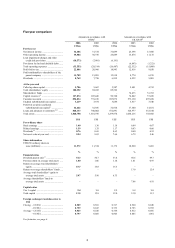
1 The definition of return on average invested capital and a reconciliation to the equivalent GAAP measures are set out on page 146.
2 The return on average total shareholders’ equity is defined as profit attributable to shareholders of the parent company divided by
average total shareholders’ equity.
3 The cost efficiency ratio is defined as total operating expenses divided by net operating income before loan impairment charges and
other credit risk provisions.
4 Each American Depositary Share (‘ADS’) represents five ordinary shares.
5 Total shareholder return (‘TSR’) is defined on page 281.
6 The Financial Times-Stock Exchange 100 Index.
7 The Morgan Stanley Capital International World Index.
8 Comparative data for 2004 excludes the provisions of IAS 32, IAS 39 and IFRS 4, which were adopted for the first time with effect from
1 January 2005.
9 The periods 2002 and 2003 were prepared in accordance with previous HSBC accounting policies under UK GAAP. HSBC’s
accounting policies under UK GAAP are stated in Note 2 on the Financial Statements in the Annual Report and Accounts 2004.
10 Capital resources are total regulatory capital, the calculation of which is set out on page 243.
11 Includes perpetual preferred securities, details of which can found in Note 32 on the Financial Statements.
12 Net of suspended interest and provisions for bad and doubtful debts (UK GAAP).
13 Net of impairment allowances (IFRSs).
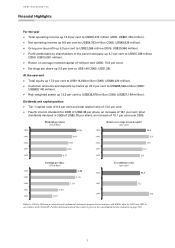
14 First, second and third interim dividends for 2006, each of US$0.15 per ordinary share, were paid on 6 July 2006, 4 October 2006 and
18 January 2007 respectively. Note 11 on the Financial Statements on page 339 gives more information on the dividends declared in
2006. On 5 March 2007, the Directors declared a fourth interim dividend for 2006 of US$0.36 per ordinary share in lieu of a final
dividend, which will be payable to ordinary shareholders on 10 May 2007 in cash in US dollars, or in sterling or Hong Kong dollars at
exchange rates to be determined on 30 April 2007, with a scrip dividend alternative. The reserves available for distribution at
31 December 2006 were US$12,045 million.
Quarterly dividends of US$15.50 per 6.20 per cent non-cumulative US dollar preference share, Series A (‘Series A dollar preference
share’), equivalent to a dividend of US$0.3875 per Series A American Depositary Shares, each of which represents one-fortieth of a
Series A dollar preference share, were paid on 15 March 2006, 15 June 2006, 15 September 2006 and 15 December 2006.
15 Dividends per share expressed as a percentage of earnings per share (2002 and 2003: excluding goodwill amortisation).
Cautionary Statement Regarding Forward-Looking Statements
The Annual Report and Accounts 2006 contains
certain forward-looking statements with respect to
the financial condition, results of operations and
business of HSBC.
Statements that are not historical facts, including
statements about HSBC’s beliefs and expectations,
are forward-looking statements. Words such as
‘expects’, ‘anticipates’, ‘intends’, ‘plans’, ‘believes’,
‘seeks’, ‘estimates’, ‘potential’ and ‘reasonably
possible’, variations of these words and similar
expressions are intended to identify forward-looking
statements. These statements are based on current
plans, estimates and projections, and therefore undue
reliance should not be placed on them. Forward-
looking statements speak only as of the date they are
made, and it should not be assumed that they have
been revised or updated in the light of new
information or future events.
Written and/or oral forward-looking statements
may also be made in the periodic reports to the