HSBC 2006 Annual Report Download - page 21
Download and view the complete annual report
Please find page 21 of the 2006 HSBC annual report below. You can navigate through the pages in the report by either clicking on the pages listed below, or by using the keyword search tool below to find specific information within the annual report.-
 1
1 -
2
-
3
-
4
-
5
-
6
-
7
-
8
-
9
-
10
-
 11
11 -
 12
12 -
 13
13 -
 14
14 -
 15
15 -
 16
16 -
 17
17 -
 18
18 -
 19
19 -
 20
20 -
 21
21 -
 22
22 -
 23
23 -
 24
24 -
 25
25 -
 26
26 -
 27
27 -
 28
28 -
 29
29 -
 30
30 -
 31
31 -
32
-
33
-
34
-
35
-
36
-
37
-
38
-
39
-
40
-
41
-
42
-
43
-
44
-
45
-
46
-
47
-
48
-
49
-
50
-
51
-
52
-
53
-
54
-
55
-
56
-
57
-
58
-
59
-
60
-
61
-
62
-
63
-
64
-
65
-
66
-
67
-
68
-
69
-
70
-
71
-
72
-
73
-
74
-
75
-
76
-
77
-
78
-
79
-
80
-
81
-
82
-
83
-
84
-
85
-
86
-
87
-
88
-
89
-
90
-
91
-
92
-
93
-
94
-
95
-
96
-
97
-
98
-
99
-
100
-
101
-
102
-
103
-
104
-
105
-
106
-
107
-
108
-
109
-
110
-
111
-
112
-
113
-
114
-
115
-
116
-
117
-
118
-
119
-
120
-
121
-
122
-
123
-
124
-
125
-
126
-
127
-
128
-
129
-
130
-
131
-
132
-
133
-
134
-
135
-
136
-
137
-
138
-
139
-
140
-
141
-
142
-
143
-
144
-
145
-
146
-
147
-
148
-
149
-
150
-
151
-
152
-
153
-
154
-
155
-
156
-
157
-
158
-
159
-
160
-
161
-
162
-
163
-
164
-
165
-
166
-
167
-
168
-
169
-
170
-
171
-
172
-
173
-
174
-
175
-
176
-
177
-
178
-
179
-
180
-
181
-
182
-
183
-
184
-
185
-
186
-
187
-
188
-
189
-
190
-
191
-
192
-
193
-
194
-
195
-
196
-
197
-
198
-
199
-
200
-
201
-
202
-
203
-
204
-
205
-
206
-
207
-
208
-
209
-
210
-
211
-
212
-
213
-
214
-
215
-
216
-
217
-
218
-
219
-
220
-
221
-
222
-
223
-
224
-
225
-
226
-
227
-
228
-
229
-
230
-
231
-
232
-
233
-
234
-
235
-
236
-
237
-
238
-
239
-
240
-
241
-
242
-
243
-
244
-
245
-
246
-
247
-
248
-
249
-
250
-
251
-
252
-
253
-
254
-
255
-
256
-
257
-
258
-
259
-
260
-
261
-
262
-
263
-
264
-
265
-
266
-
267
-
268
-
269
-
270
-
271
-
272
-
273
-
274
-
275
-
276
-
277
-
278
-
279
-
280
-
281
-
282
-
283
-
284
-
285
-
286
-
287
-
288
-
289
-
290
-
291
-
292
-
293
-
294
-
295
-
296
-
297
-
298
-
299
-
300
-
301
-
302
-
303
-
304
-
305
-
306
-
307
-
308
-
309
-
310
-
311
-
312
-
313
-
314
-
315
-
316
-
317
-
318
-
319
-
320
-
321
-
322
-
323
-
324
-
325
-
326
-
327
-
328
-
329
-
330
-
331
-
332
-
333
-
334
-
335
-
336
-
337
-
338
-
339
-
340
-
341
-
342
-
343
-
344
-
345
-
346
-
347
-
348
-
349
-
350
-
351
-
352
-
353
-
354
-
355
-
356
-
357
-
358
-
359
-
360
-
361
-
362
-
363
-
364
-
365
-
366
-
367
-
368
-
369
-
370
-
371
-
372
-
373
-
374
-
375
-
376
-
377
-
378
-
379
-
380
-
381
-
382
-
383
-
384
-
385
-
386
-
387
-
388
-
389
-
390
-
391
-
392
-
393
-
394
-
395
-
396
-
397
-
398
-
399
-
400
-
401
-
402
-
403
-
404
-
405
-
406
-
407
-
408
-
409
-
410
-
411
-
412
-
413
-
414
-
415
-
416
-
417
-
418
-
419
-
420
-
421
-
422
-
423
-
424
-
425
-
426
-
427
-
428
-
429
-
430
-
431
-
432
-
433
-
434
-
435
-
436
-
437
-
438
-
439
-
440
-
441
-
442
-
443
-
444
-
445
-
446
-
447
-
448
-
449
-
450
-
451
-
452
-
453
-
454
-
455
-
456
-
457
-
458
 |
 |

19
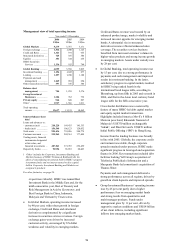
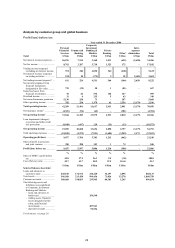
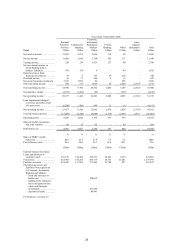
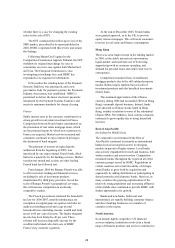
Management view of total operating income
Year ended 31 December
2006
US$m
2005
US$m
2004
US$m
Global Markets ............. 5,279 3,767 3,171
Foreign exchange ............ 1,516 1,200 1,125
Credit and Rates .............. 1,321 931 655
Structured derivatives ..... 725 387 386
Equities ........................... 381 324 256
HSBC Securities
Services ........................ 1,336 925 749
Global Banking ............. 4,059 3,530 3,065
Investment banking ........ 1,156 1,022 877
Lending ........................... 1,257 1,260 1,188
Payments and cash
management ................. 1,249 901 694
Other transaction services 397 347 306
Balance sheet
management ............... 704 1,238 2,376
Group Investment
Businesses ................... 1,104 762 732
Private equity ................ 564 648 207
Other1 .............................. 1,927 1,566 1,011
Total operating
income .......................... 13,637 11,511 10,562
Selected balance sheet
data5
Loans and advances to:
– customers (net) ............ 210,220 169,435 145,353
– banks (net) ................... 156,548 106,123 128,032
Total assets ...................... 994,436 755,056 584,779
Customer accounts .......... 235,965 202,361 177,449
Trading assets, financial
instruments designated
at fair value, and
financial investments ... 487,943 373,787 252,459
Deposits by banks ........... 92,954 65,853 80,443
1 ‘Other’ includes the Corporate, Investment Banking and
Markets business of HSBC Trinkaus & Burkhardt AG, the
effect of consolidating investments held by HSBC’s property
investment funds, and net interest earned on free capital
held in Corporate, Investment Banking and Markets not
assigned to products.
For other footnotes, see page 26.
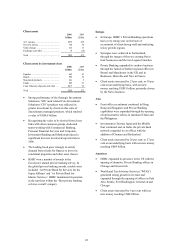
Acquisitions Monthly. HSBC was named Best
Investment Bank in the Middle East and, for the
ninth consecutive year, Best at Treasury and
Risk Management in Asia by Euromoney, and
Best Foreign Bank in China, Indonesia,
Malaysia and Vietnam by FinanceAsia.
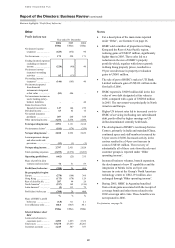
• In Global Markets, operating income increased
by 40 per cent, with robust growth in foreign
exchange, Credit and Rates and structured
derivatives complemented by a significant
increase in securities services revenues. Foreign
exchange gains were driven by increased
customer activity, encouraged by US dollar
weakness and volatility in emerging markets.
Credit and Rates revenue was boosted by an
enhanced product range, market volatility and
increased investor appetite for emerging market
bonds. A substantial rise in structured
derivatives income reflected enhanced sales
coverage. The securities services business
benefited from increased customer volumes in
higher-value products and strong income growth
in emerging markets. Assets under custody rose
by 28 per cent.
• In Global Banking, total operating income rose
by 15 per cent, due to a strong performance in
payments and cash management and improved
results in investment banking. In the latter,
satisfactory progress in capital markets resulted
in HSBC being ranked fourth in the
international bond league table, according to
Bloomberg, up from fifth in 2005 and seventh in
2004, and first in the Asian local currency bond
league table for the fifth consecutive year.
Cross-border distribution was a noteworthy
feature of many HSBC-led debt capital market
and equity capital market transactions.
Highlights included America Movil’s 8 billion
Mexican peso bond; Khazanah Nasional of
Malaysia’s US$750 million exchangeable
‘Sukuk’; and Shui On Land’s US$876 million
Initial Public Offering (‘IPO’) in Hong Kong.
Income from the lending business was broadly
in line with 2005. Globally, the corporate credit
environment was stable, though corporate
spreads remained under pressure. HSBC made
significant progress in leveraged and acquisition
finance in 2006. Key transactions included debt
facilities backing Yell Group’s acquisition of
Telefonica Publicidad e Informacion and a
Macquarie Bank-led consortium’s acquisition of
Thames Water.
Payments and cash management delivered a
strong performance across all regions, driven by
growth in client deposits and improved spreads.
• Group Investment Businesses’ operating income
rose by 45 per cent partly due to higher
performance fees on emerging market funds
and strong results from quantitative and
multi-manager products. Funds under
management grew by 11 per cent, driven by
supportive market conditions and US$14 billion
of net client inflows, including significant
inflows into emerging market funds.