HSBC 2006 Annual Report Download - page 106
Download and view the complete annual report
Please find page 106 of the 2006 HSBC annual report below. You can navigate through the pages in the report by either clicking on the pages listed below, or by using the keyword search tool below to find specific information within the annual report.-
 1
1 -
2
-
3
-
4
-
5
-
6
-
7
-
8
-
9
-
10
-
11
-
12
-
13
-
14
-
15
-
16
-
17
-
18
-
19
-
20
-
21
-
22
-
23
-
24
-
25
-
26
-
27
-
28
-
29
-
30
-
31
-
32
-
33
-
34
-
35
-
36
-
37
-
38
-
39
-
40
-
41
-
42
-
43
-
44
-
45
-
46
-
47
-
48
-
49
-
50
-
51
-
52
-
53
-
54
-
55
-
56
-
57
-
58
-
59
-
60
-
61
-
62
-
63
-
64
-
65
-
66
-
67
-
68
-
69
-
70
-
71
-
72
-
73
-
74
-
75
-
76
-
77
-
78
-
79
-
80
-
81
-
82
-
83
-
84
-
85
-
86
-
87
-
88
-
89
-
90
-
91
-
92
-
93
-
94
-
95
-
 96
96 -
 97
97 -
 98
98 -
 99
99 -
 100
100 -
 101
101 -
 102
102 -
 103
103 -
 104
104 -
 105
105 -
 106
106 -
 107
107 -
 108
108 -
 109
109 -
 110
110 -
 111
111 -
 112
112 -
 113
113 -
 114
114 -
 115
115 -
 116
116 -
117
-
118
-
119
-
120
-
121
-
122
-
123
-
124
-
125
-
126
-
127
-
128
-
129
-
130
-
131
-
132
-
133
-
134
-
135
-
136
-
137
-
138
-
139
-
140
-
141
-
142
-
143
-
144
-
145
-
146
-
147
-
148
-
149
-
150
-
151
-
152
-
153
-
154
-
155
-
156
-
157
-
158
-
159
-
160
-
161
-
162
-
163
-
164
-
165
-
166
-
167
-
168
-
169
-
170
-
171
-
172
-
173
-
174
-
175
-
176
-
177
-
178
-
179
-
180
-
181
-
182
-
183
-
184
-
185
-
186
-
187
-
188
-
189
-
190
-
191
-
192
-
193
-
194
-
195
-
196
-
197
-
198
-
199
-
200
-
201
-
202
-
203
-
204
-
205
-
206
-
207
-
208
-
209
-
210
-
211
-
212
-
213
-
214
-
215
-
216
-
217
-
218
-
219
-
220
-
221
-
222
-
223
-
224
-
225
-
226
-
227
-
228
-
229
-
230
-
231
-
232
-
233
-
234
-
235
-
236
-
237
-
238
-
239
-
240
-
241
-
242
-
243
-
244
-
245
-
246
-
247
-
248
-
249
-
250
-
251
-
252
-
253
-
254
-
255
-
256
-
257
-
258
-
259
-
260
-
261
-
262
-
263
-
264
-
265
-
266
-
267
-
268
-
269
-
270
-
271
-
272
-
273
-
274
-
275
-
276
-
277
-
278
-
279
-
280
-
281
-
282
-
283
-
284
-
285
-
286
-
287
-
288
-
289
-
290
-
291
-
292
-
293
-
294
-
295
-
296
-
297
-
298
-
299
-
300
-
301
-
302
-
303
-
304
-
305
-
306
-
307
-
308
-
309
-
310
-
311
-
312
-
313
-
314
-
315
-
316
-
317
-
318
-
319
-
320
-
321
-
322
-
323
-
324
-
325
-
326
-
327
-
328
-
329
-
330
-
331
-
332
-
333
-
334
-
335
-
336
-
337
-
338
-
339
-
340
-
341
-
342
-
343
-
344
-
345
-
346
-
347
-
348
-
349
-
350
-
351
-
352
-
353
-
354
-
355
-
356
-
357
-
358
-
359
-
360
-
361
-
362
-
363
-
364
-
365
-
366
-
367
-
368
-
369
-
370
-
371
-
372
-
373
-
374
-
375
-
376
-
377
-
378
-
379
-
380
-
381
-
382
-
383
-
384
-
385
-
386
-
387
-
388
-
389
-
390
-
391
-
392
-
393
-
394
-
395
-
396
-
397
-
398
-
399
-
400
-
401
-
402
-
403
-
404
-
405
-
406
-
407
-
408
-
409
-
410
-
411
-
412
-
413
-
414
-
415
-
416
-
417
-
418
-
419
-
420
-
421
-
422
-
423
-
424
-
425
-
426
-
427
-
428
-
429
-
430
-
431
-
432
-
433
-
434
-
435
-
436
-
437
-
438
-
439
-
440
-
441
-
442
-
443
-
444
-
445
-
446
-
447
-
448
-
449
-
450
-
451
-
452
-
453
-
454
-
455
-
456
-
457
-
458
 |
 |

HSBC HOLDINGS PLC
Report of the Directors: Business Review (continued)
Latin America > Profit/(loss) before tax
104
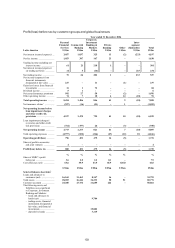
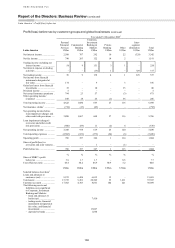
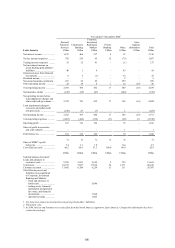
Profit/(loss) before tax by customer groups and global businesses (continued)
Year ended 31 December 20053
Latin America
Personal
Financial
Services
US$m
Commercial
Banking
US$m
Corporate,
Investment
Banking &
Markets
US$m
Private
Banking
US$m
Other
US$m
Inter-
segment
elimination
US$m
Total
US$m
Net interest income ..................... 2,580 767 292 10 22 (329) 3,342
Net fee income ............................ 790 263 122 14 2 – 1,191
Trading income excluding net
interest income ....................... 56 9 151 31 – 220
Net interest expense on trading
activities .................................. – – (13) 1 – 329 317
Net trading income ..................... 56 9 138 4 1 329 537
Net income from financial
instruments designated at
fair value ................................. 174 – 9 – 3 – 186
Gains less losses from financial
investments ............................. 35 – 10 – 35 – 80
Dividend income ......................... 5 – – – – – 5
Net earned insurance premiums . 794 23 57 – (3) – 871
Other operating income/
(expense) ................................ 188 18 25 (1) 56 – 286
Total operating income ............... 4,622 1,080 653 27 116 – 6,498
Net insurance claims1 ................. (734) (13) (45) – – – (792)
Net operating income before
loan impairment charges and
other credit risk provisions ..... 3,888 1,067 608 27 116 – 5,706
Loan impairment (charges)/
recoveries and other credit
risk provisions ........................ (600) (89) 11 (2) 4 – (676)
Net operating income ................. 3,288 978 619 25 120 – 5,030
Total operating expenses ............ (2,502) (621) (273) (24) (6) – (3,426)
Operating profit .......................... 786 357 346 1 114 – 1,604
Share of profit/(loss) in
associates and joint ventures .. – – 1 – (1) – –
Profit before tax .......................... 786 357 347 1 113 – 1,604
% % % % % %
Share of HSBC’s profit
before tax ................................ 3.8 1.7 1.7 – 0.5 7.7
Cost efficiency ratio ................... 64.4 58.2 44.9 88.9 5.2 60.0
US$m US$m US$m US$m US$m US$m
Selected balance sheet data2
Loans and advances to
customers (net) ....................... 9,233 6,424 6,012 12 – 21,681
Total assets ................................. 15,723 9,491 28,509 53 1,611 55,387
Customer accounts ...................... 17,302 4,703 8,661 102 221 30,989
The following assets and
liabilities were significant
to Corporate, Investment
Banking and Markets:
– loans and advances to
banks (net) .......................... 7,410
– trading assets, financial
instruments designated at
fair value, and financial
investments ......................... 13,067
– deposits by banks ............... 1,858