HSBC 2006 Annual Report Download - page 116
Download and view the complete annual report
Please find page 116 of the 2006 HSBC annual report below. You can navigate through the pages in the report by either clicking on the pages listed below, or by using the keyword search tool below to find specific information within the annual report.-
 1
1 -
2
-
3
-
4
-
5
-
6
-
7
-
8
-
9
-
10
-
11
-
12
-
13
-
14
-
15
-
16
-
17
-
18
-
19
-
20
-
21
-
22
-
23
-
24
-
25
-
26
-
27
-
28
-
29
-
30
-
31
-
32
-
33
-
34
-
35
-
36
-
37
-
38
-
39
-
40
-
41
-
42
-
43
-
44
-
45
-
46
-
47
-
48
-
49
-
50
-
51
-
52
-
53
-
54
-
55
-
56
-
57
-
58
-
59
-
60
-
61
-
62
-
63
-
64
-
65
-
66
-
67
-
68
-
69
-
70
-
71
-
72
-
73
-
74
-
75
-
76
-
77
-
78
-
79
-
80
-
81
-
82
-
83
-
84
-
85
-
86
-
87
-
88
-
89
-
90
-
91
-
92
-
93
-
94
-
95
-
96
-
97
-
98
-
99
-
100
-
101
-
102
-
103
-
104
-
105
-
 106
106 -
 107
107 -
 108
108 -
 109
109 -
 110
110 -
 111
111 -
 112
112 -
 113
113 -
 114
114 -
 115
115 -
 116
116 -
 117
117 -
 118
118 -
 119
119 -
 120
120 -
 121
121 -
 122
122 -
 123
123 -
 124
124 -
 125
125 -
 126
126 -
127
-
128
-
129
-
130
-
131
-
132
-
133
-
134
-
135
-
136
-
137
-
138
-
139
-
140
-
141
-
142
-
143
-
144
-
145
-
146
-
147
-
148
-
149
-
150
-
151
-
152
-
153
-
154
-
155
-
156
-
157
-
158
-
159
-
160
-
161
-
162
-
163
-
164
-
165
-
166
-
167
-
168
-
169
-
170
-
171
-
172
-
173
-
174
-
175
-
176
-
177
-
178
-
179
-
180
-
181
-
182
-
183
-
184
-
185
-
186
-
187
-
188
-
189
-
190
-
191
-
192
-
193
-
194
-
195
-
196
-
197
-
198
-
199
-
200
-
201
-
202
-
203
-
204
-
205
-
206
-
207
-
208
-
209
-
210
-
211
-
212
-
213
-
214
-
215
-
216
-
217
-
218
-
219
-
220
-
221
-
222
-
223
-
224
-
225
-
226
-
227
-
228
-
229
-
230
-
231
-
232
-
233
-
234
-
235
-
236
-
237
-
238
-
239
-
240
-
241
-
242
-
243
-
244
-
245
-
246
-
247
-
248
-
249
-
250
-
251
-
252
-
253
-
254
-
255
-
256
-
257
-
258
-
259
-
260
-
261
-
262
-
263
-
264
-
265
-
266
-
267
-
268
-
269
-
270
-
271
-
272
-
273
-
274
-
275
-
276
-
277
-
278
-
279
-
280
-
281
-
282
-
283
-
284
-
285
-
286
-
287
-
288
-
289
-
290
-
291
-
292
-
293
-
294
-
295
-
296
-
297
-
298
-
299
-
300
-
301
-
302
-
303
-
304
-
305
-
306
-
307
-
308
-
309
-
310
-
311
-
312
-
313
-
314
-
315
-
316
-
317
-
318
-
319
-
320
-
321
-
322
-
323
-
324
-
325
-
326
-
327
-
328
-
329
-
330
-
331
-
332
-
333
-
334
-
335
-
336
-
337
-
338
-
339
-
340
-
341
-
342
-
343
-
344
-
345
-
346
-
347
-
348
-
349
-
350
-
351
-
352
-
353
-
354
-
355
-
356
-
357
-
358
-
359
-
360
-
361
-
362
-
363
-
364
-
365
-
366
-
367
-
368
-
369
-
370
-
371
-
372
-
373
-
374
-
375
-
376
-
377
-
378
-
379
-
380
-
381
-
382
-
383
-
384
-
385
-
386
-
387
-
388
-
389
-
390
-
391
-
392
-
393
-
394
-
395
-
396
-
397
-
398
-
399
-
400
-
401
-
402
-
403
-
404
-
405
-
406
-
407
-
408
-
409
-
410
-
411
-
412
-
413
-
414
-
415
-
416
-
417
-
418
-
419
-
420
-
421
-
422
-
423
-
424
-
425
-
426
-
427
-
428
-
429
-
430
-
431
-
432
-
433
-
434
-
435
-
436
-
437
-
438
-
439
-
440
-
441
-
442
-
443
-
444
-
445
-
446
-
447
-
448
-
449
-
450
-
451
-
452
-
453
-
454
-
455
-
456
-
457
-
458
 |
 |

HSBC HOLDINGS PLC
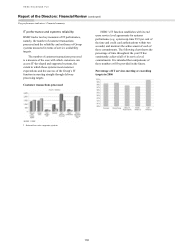
Report of the Directors: Financial Review (continued)
Critical accounting policies / Key performance indicators
114
acquired business is greater than the cost of
acquisition, the excess is recognised immediately in
the income statement.
Goodwill is allocated to cash-generating units
(‘CGU’) for the purpose of impairment testing,
which is undertaken at the lowest level at which
goodwill is monitored for internal management
purposes. Impairment testing is performed at least
annually by comparing the present value of the
expected future cash flows from a business with the
carrying amount of its net assets, including
attributable goodwill.
Significant management judgement is involved
in two aspects of the process of identifying and
evaluating goodwill impairment.
First, the cost of capital assigned to an
individual CGU and used to discount its future cash
flows can have a significant effect on the CGU’s
valuation. The cost of capital percentage is generally
derived from a Capital Asset Pricing Model, which
itself depends on inputs reflecting a number of
financial and economic variables including the risk-
free interest rate in the country concerned and a
premium to reflect the inherent risk of the business
being evaluated. These variables are established on
the basis of management judgement.
Second, management judgement is required in
estimating the future cash flows of the CGU. These
values are sensitive to the cash flows projected for
the periods for which detailed forecasts are available,
and to assumptions regarding the long-term pattern
of sustainable cash flows thereafter. While the
acceptable range within which underlying
assumptions can be applied is governed by the
requirement to compare resulting forecasts with
actual performance and verifiable economic data in
future years, the cash flow forecasts necessarily and
appropriately reflect management’s view of future
business prospects.
When this exercise demonstrates that the
expected cash flows of a CGU have declined and/or
that its cost of capital has increased, the effect is to
reduce the CGU’s estimated fair value. If this results
in an estimated recoverable amount that is lower
than the carrying value of the CGU, a charge for
impairment of goodwill will be recorded, thereby
reducing by a corresponding amount HSBC’s profit
for the year. Goodwill is stated at cost less
accumulated impairment losses.
Goodwill on acquisitions of interests in joint
ventures or associates is included in ‘Interests in
associates and joint ventures’.
At the date of disposal of a business, attributable
goodwill is included in HSBC’s share of net assets in
the calculation of the gain or loss on disposal.
Valuation of financial instruments
HSBC’s accounting policy for valuation of financial
instruments is described in Note 2(d) on the
Financial Statements.
All financial instruments are recognised initially
at fair value. The fair value of a financial instrument
on initial recognition is normally the transaction
price, i.e. the fair value of the consideration given or
received. In certain circumstances, however, the
initial fair value may be based on other observable
current market transactions in the same instrument,
without modification or repackaging, or on a
valuation technique whose variables include only
data from observable markets.
Subsequent to initial recognition, the fair values
of financial instruments measured at fair value that
are quoted in active markets are based on bid prices
for assets held and offer prices for liabilities. When
independent prices are not available, fair values are
determined by using valuation techniques which
refer to observable market data. These include
comparisons with similar financial instruments for
which market observable prices exist, discounted
cash flow analyses, option pricing models and other
valuation techniques commonly used by market
participants.
The main factors which management considers
when applying a model are:
• the likelihood and expected timing of future
cash flows on the instrument. These cash flows
are usually governed by the terms of the
instrument, although management judgement
may be required when the ability of the
counterparty to service the instrument in
accordance with the contractual terms is in
doubt; and
• an appropriate discount rate for the instrument.
Management determines this rate, based on its
assessment of the appropriate spread of the rate
for the instrument over the risk-free rate.
When valuing instruments by reference to
comparable instruments, management takes into
account the maturity, structure and rating of the
instrument with which the position held is being
compared. When valuing instruments on a model
basis using the fair value of underlying components,
management considers, in addition, the need for
adjustments to take account of factors such as bid-
offer spread, credit profile and model uncertainty.