HSBC 2006 Annual Report Download - page 346
Download and view the complete annual report
Please find page 346 of the 2006 HSBC annual report below. You can navigate through the pages in the report by either clicking on the pages listed below, or by using the keyword search tool below to find specific information within the annual report.-
 1
1 -
2
-
3
-
4
-
5
-
6
-
7
-
8
-
9
-
10
-
11
-
12
-
13
-
14
-
15
-
16
-
17
-
18
-
19
-
20
-
21
-
22
-
23
-
24
-
25
-
26
-
27
-
28
-
29
-
30
-
31
-
32
-
33
-
34
-
35
-
36
-
37
-
38
-
39
-
40
-
41
-
42
-
43
-
44
-
45
-
46
-
47
-
48
-
49
-
50
-
51
-
52
-
53
-
54
-
55
-
56
-
57
-
58
-
59
-
60
-
61
-
62
-
63
-
64
-
65
-
66
-
67
-
68
-
69
-
70
-
71
-
72
-
73
-
74
-
75
-
76
-
77
-
78
-
79
-
80
-
81
-
82
-
83
-
84
-
85
-
86
-
87
-
88
-
89
-
90
-
91
-
92
-
93
-
94
-
95
-
96
-
97
-
98
-
99
-
100
-
101
-
102
-
103
-
104
-
105
-
106
-
107
-
108
-
109
-
110
-
111
-
112
-
113
-
114
-
115
-
116
-
117
-
118
-
119
-
120
-
121
-
122
-
123
-
124
-
125
-
126
-
127
-
128
-
129
-
130
-
131
-
132
-
133
-
134
-
135
-
136
-
137
-
138
-
139
-
140
-
141
-
142
-
143
-
144
-
145
-
146
-
147
-
148
-
149
-
150
-
151
-
152
-
153
-
154
-
155
-
156
-
157
-
158
-
159
-
160
-
161
-
162
-
163
-
164
-
165
-
166
-
167
-
168
-
169
-
170
-
171
-
172
-
173
-
174
-
175
-
176
-
177
-
178
-
179
-
180
-
181
-
182
-
183
-
184
-
185
-
186
-
187
-
188
-
189
-
190
-
191
-
192
-
193
-
194
-
195
-
196
-
197
-
198
-
199
-
200
-
201
-
202
-
203
-
204
-
205
-
206
-
207
-
208
-
209
-
210
-
211
-
212
-
213
-
214
-
215
-
216
-
217
-
218
-
219
-
220
-
221
-
222
-
223
-
224
-
225
-
226
-
227
-
228
-
229
-
230
-
231
-
232
-
233
-
234
-
235
-
236
-
237
-
238
-
239
-
240
-
241
-
242
-
243
-
244
-
245
-
246
-
247
-
248
-
249
-
250
-
251
-
252
-
253
-
254
-
255
-
256
-
257
-
258
-
259
-
260
-
261
-
262
-
263
-
264
-
265
-
266
-
267
-
268
-
269
-
270
-
271
-
272
-
273
-
274
-
275
-
276
-
277
-
278
-
279
-
280
-
281
-
282
-
283
-
284
-
285
-
286
-
287
-
288
-
289
-
290
-
291
-
292
-
293
-
294
-
295
-
296
-
297
-
298
-
299
-
300
-
301
-
302
-
303
-
304
-
305
-
306
-
307
-
308
-
309
-
310
-
311
-
312
-
313
-
314
-
315
-
316
-
317
-
318
-
319
-
320
-
321
-
322
-
323
-
324
-
325
-
326
-
327
-
328
-
329
-
330
-
331
-
332
-
333
-
334
-
335
-
 336
336 -
 337
337 -
 338
338 -
 339
339 -
 340
340 -
 341
341 -
 342
342 -
 343
343 -
 344
344 -
 345
345 -
 346
346 -
 347
347 -
 348
348 -
 349
349 -
 350
350 -
 351
351 -
 352
352 -
 353
353 -
 354
354 -
 355
355 -
 356
356 -
357
-
358
-
359
-
360
-
361
-
362
-
363
-
364
-
365
-
366
-
367
-
368
-
369
-
370
-
371
-
372
-
373
-
374
-
375
-
376
-
377
-
378
-
379
-
380
-
381
-
382
-
383
-
384
-
385
-
386
-
387
-
388
-
389
-
390
-
391
-
392
-
393
-
394
-
395
-
396
-
397
-
398
-
399
-
400
-
401
-
402
-
403
-
404
-
405
-
406
-
407
-
408
-
409
-
410
-
411
-
412
-
413
-
414
-
415
-
416
-
417
-
418
-
419
-
420
-
421
-
422
-
423
-
424
-
425
-
426
-
427
-
428
-
429
-
430
-
431
-
432
-
433
-
434
-
435
-
436
-
437
-
438
-
439
-
440
-
441
-
442
-
443
-
444
-
445
-
446
-
447
-
448
-
449
-
450
-
451
-
452
-
453
-
454
-
455
-
456
-
457
-
458
 |
 |

HSBC HOLDINGS PLC
Notes on the Financial Statements (continued)
Note 13
344
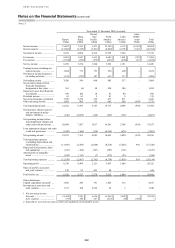
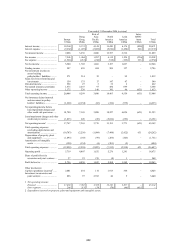
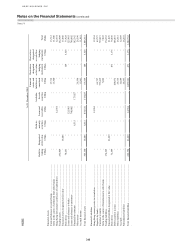
By customer group
HSBC’s operations include a number of shared support services and head office functions. The costs of these
functions are allocated to customer groups, where appropriate, on a systematic and consistent basis. In addition, a
number of income and expense items include the effect of financial transactions entered into in the ordinary course of
business between customer groups co-operating within the integrated HSBC Group. The following analysis includes
inter-segment amounts within each customer group with the elimination shown in a separate column.
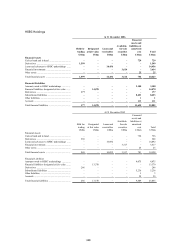
Total assets
At 31 December 2006 At 31 December 2005
US$m % US$m %
Personal Financial Services ............................................................................. 546,568 29.4 484,314 32.2
Commercial Banking ....................................................................................... 213,450 11.5 175,120 11.7
Corporate, Investment Banking and Markets .................................................. 994,436 53.5 755,056 50.3
Private Banking ............................................................................................... 73,026 3.9 59,827 4.0
Other ................................................................................................................ 33,278 1.7 27,653 1.8
Total assets ....................................................................................................... 1,860,758 100.0 1,501,970 100.0
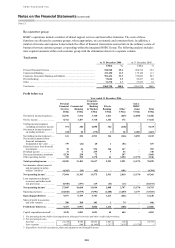
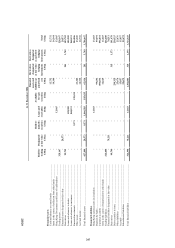
Profit before tax
Year ended 31 December 2006
Personal
Financial
Services
Commercial
Banking
Corporate,
Investment
Banking
& Markets
Private
Banking Other
Intra-
HSBC
items
Total
US$m US$m US$m US$m US$m US$m US$m
Net interest income/(expense) .... 26,076 7,514 3,168 1,011 (625) (2,658) 34,486
Net fee income ............................ 8,762 3,207 3,718 1,323 172 – 17,182
Trading income/(expense)
excluding net interest income . 391 204 4,890 362 (228) – 5,619
Net interest income/(expense)
on trading activities ................ 220 20 (379) 2 82 2,658 2,603
Net trading income/(expense) ..... 611 224 4,511 364 (146) 2,658 8,222
Net income/(expense) from
financial instruments
designated at fair value ........... 739 (22) 20 1 (81) – 657
Gains less losses from financial
investments ............................. 78 44 534 166 147 – 969
Dividend income ......................... 31 6 235 5 63 – 340
Net earned insurance premiums . 5,130 258 73 – 207 – 5,668
Other operating income .............. 782 250 1,378 61 3,254 (3,179) 2,546
Total operating income ............ 42,209 11,481 13,637 2,931 2,991 (3,179) 70,070
Net insurance claims incurred
and movement in policy-
holders’ liabilities ................... (4,365) (96) (62) – (181) – (4,704)
Net operating income1 ............... 37,844 11,385 13,575 2,931 2,810 (3,179) 65,366
Loan impairment (charges)/
recoveries and other credit
risk provisions ........................ (9,949) (697) 119 (33) (13) – (10,573)
Net operating income2 .............. 27,895 10,688 13,694 2,898 2,797 (3,179) 54,793
Operating expenses ..................... (18,818) (4,979) (7,991) (1,685) (3,259) 3,179 (33,553)
Operating profit/(loss) .............. 9,077 5,709 5,703 1,213 (462) – 21,240
Share of profit in associates
and joint ventures ................... 380 288 103 1 74 – 846
Profit/(loss) before tax .............. 9,457 5,997 5,806 1,214 (388) – 22,086
Capital expenditure incurred3 ..... 2,150 1,083 1,021 45 684 – 4,983
1 Net operating income before loan impairment (charges)/recoveries and other credit risk provisions.
2 Net operating income:
External .................................. 23,238 9,692 20,034 1,661 168 – 54,793
Inter-segment .......................... 4,657 996 (6,340) 1,237 2,629 (3,179) –
3 Expenditure incurred on property, plant and equipment and intangible assets.