HSBC 2006 Annual Report Download - page 47
Download and view the complete annual report
Please find page 47 of the 2006 HSBC annual report below. You can navigate through the pages in the report by either clicking on the pages listed below, or by using the keyword search tool below to find specific information within the annual report.-
 1
1 -
2
-
3
-
4
-
5
-
6
-
7
-
8
-
9
-
10
-
11
-
12
-
13
-
14
-
15
-
16
-
17
-
18
-
19
-
20
-
21
-
22
-
23
-
24
-
25
-
26
-
27
-
28
-
29
-
30
-
31
-
32
-
33
-
34
-
35
-
36
-
 37
37 -
 38
38 -
 39
39 -
 40
40 -
 41
41 -
 42
42 -
 43
43 -
 44
44 -
 45
45 -
 46
46 -
 47
47 -
 48
48 -
 49
49 -
 50
50 -
 51
51 -
 52
52 -
 53
53 -
 54
54 -
 55
55 -
 56
56 -
 57
57 -
58
-
59
-
60
-
61
-
62
-
63
-
64
-
65
-
66
-
67
-
68
-
69
-
70
-
71
-
72
-
73
-
74
-
75
-
76
-
77
-
78
-
79
-
80
-
81
-
82
-
83
-
84
-
85
-
86
-
87
-
88
-
89
-
90
-
91
-
92
-
93
-
94
-
95
-
96
-
97
-
98
-
99
-
100
-
101
-
102
-
103
-
104
-
105
-
106
-
107
-
108
-
109
-
110
-
111
-
112
-
113
-
114
-
115
-
116
-
117
-
118
-
119
-
120
-
121
-
122
-
123
-
124
-
125
-
126
-
127
-
128
-
129
-
130
-
131
-
132
-
133
-
134
-
135
-
136
-
137
-
138
-
139
-
140
-
141
-
142
-
143
-
144
-
145
-
146
-
147
-
148
-
149
-
150
-
151
-
152
-
153
-
154
-
155
-
156
-
157
-
158
-
159
-
160
-
161
-
162
-
163
-
164
-
165
-
166
-
167
-
168
-
169
-
170
-
171
-
172
-
173
-
174
-
175
-
176
-
177
-
178
-
179
-
180
-
181
-
182
-
183
-
184
-
185
-
186
-
187
-
188
-
189
-
190
-
191
-
192
-
193
-
194
-
195
-
196
-
197
-
198
-
199
-
200
-
201
-
202
-
203
-
204
-
205
-
206
-
207
-
208
-
209
-
210
-
211
-
212
-
213
-
214
-
215
-
216
-
217
-
218
-
219
-
220
-
221
-
222
-
223
-
224
-
225
-
226
-
227
-
228
-
229
-
230
-
231
-
232
-
233
-
234
-
235
-
236
-
237
-
238
-
239
-
240
-
241
-
242
-
243
-
244
-
245
-
246
-
247
-
248
-
249
-
250
-
251
-
252
-
253
-
254
-
255
-
256
-
257
-
258
-
259
-
260
-
261
-
262
-
263
-
264
-
265
-
266
-
267
-
268
-
269
-
270
-
271
-
272
-
273
-
274
-
275
-
276
-
277
-
278
-
279
-
280
-
281
-
282
-
283
-
284
-
285
-
286
-
287
-
288
-
289
-
290
-
291
-
292
-
293
-
294
-
295
-
296
-
297
-
298
-
299
-
300
-
301
-
302
-
303
-
304
-
305
-
306
-
307
-
308
-
309
-
310
-
311
-
312
-
313
-
314
-
315
-
316
-
317
-
318
-
319
-
320
-
321
-
322
-
323
-
324
-
325
-
326
-
327
-
328
-
329
-
330
-
331
-
332
-
333
-
334
-
335
-
336
-
337
-
338
-
339
-
340
-
341
-
342
-
343
-
344
-
345
-
346
-
347
-
348
-
349
-
350
-
351
-
352
-
353
-
354
-
355
-
356
-
357
-
358
-
359
-
360
-
361
-
362
-
363
-
364
-
365
-
366
-
367
-
368
-
369
-
370
-
371
-
372
-
373
-
374
-
375
-
376
-
377
-
378
-
379
-
380
-
381
-
382
-
383
-
384
-
385
-
386
-
387
-
388
-
389
-
390
-
391
-
392
-
393
-
394
-
395
-
396
-
397
-
398
-
399
-
400
-
401
-
402
-
403
-
404
-
405
-
406
-
407
-
408
-
409
-
410
-
411
-
412
-
413
-
414
-
415
-
416
-
417
-
418
-
419
-
420
-
421
-
422
-
423
-
424
-
425
-
426
-
427
-
428
-
429
-
430
-
431
-
432
-
433
-
434
-
435
-
436
-
437
-
438
-
439
-
440
-
441
-
442
-
443
-
444
-
445
-
446
-
447
-
448
-
449
-
450
-
451
-
452
-
453
-
454
-
455
-
456
-
457
-
458
 |
 |

45
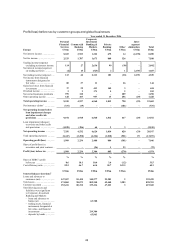
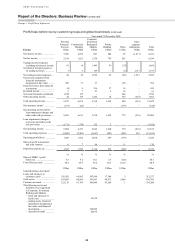
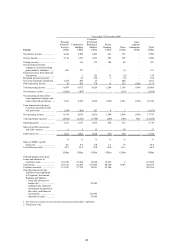
Profit/(loss) before tax by customer groups and global businesses
Year ended 31 December 2006
Europe
Personal
Financial
Services
US$m
Commercial
Banking
US$m
Corporate,
Investment
Banking &
Markets
US$m
Private
Banking
US$m
Other
US$m
Inter-
segment
elimination
US$m
Total
US$m
Net interest income ..................... 5,653 2,923 1,222 675 14 (2,198) 8,289
Net fee income ............................ 2,533 1,707 1,673 869 326 – 7,108
Trading income/(expense)
excluding net interest income 119 27 2,636 99 (39) – 2,842
Net interest income/(expense)
on trading activities ................ (6) 15 (523) 2 1 2,198 1,687
Net trading income/(expense) .... 113 42 2,113 101 (38) 2,198 4,529
Net income from financial
instruments designated at
fair value ................................. 80 27 11 – 26 – 144
Gains less losses from financial
investments ............................. 37 22 413 149 3 – 624
Dividend income ......................... 2 3 171 5 2 – 183
Net earned insurance premiums . 979 110 – – 209 – 1,298
Other operating income .............. 128 103 957 13 256 (29) 1,428
Total operating income ............ 9,525 4,937 6,560 1,812 798 (29) 23,603
Net insurance claims1 ................. (331) (19) – – (181) – (531)
Net operating income before
loan impairment charges
and other credit risk
provisions .............................. 9,194 4,918 6,560 1,812 617 (29) 23,072
Loan impairment (charges)/
recoveries and other credit
risk provisions ........................ (1,838) (386) 64 2 3 – (2,155)
Net operating income ............... 7,356 4,532 6,624 1,814 620 (29) 20,917
Total operating expenses ............ (5,447) (2,298) (4,224) (1,010) (921) 29 (13,871)
Operating profit/(loss) .............. 1,909 2,234 2,400 804 (301) – 7,046
Share of profit/(loss) in
associates and joint ventures .. – – (96) 1 23 – (72)
Profit/(loss) before tax .............. 1,909 2,234 2,304 805 (278) – 6,974
% % % % % %
Share of HSBC’s profit
before tax ................................ 8.6 10.1 10.4 3.6 (1.2) 31.5
Cost efficiency ratio .................... 59.2 46.7 64.4 55.7 149.3 60.1
US$m US$m US$m US$m US$m US$m
Selected balance sheet data2
Loans and advances to
customers (net) ....................... 147,507 81,430 140,277 23,283 2 392,499
Total assets .................................. 174,865 98,073 502,340 49,440 3,983 828,701
Customer accounts ...................... 152,411 80,312 139,416 47,223 3 419,365
The following assets and
liabilities were significant
to Corporate, Investment
Banking and Markets:
– loans and advances to
banks (net) .......................... 63,788
– trading assets, financial
instruments designated at
fair value, and financial
investments ......................... 219,304
– deposits by banks ................ 65,963