HSBC 2006 Annual Report Download - page 180
Download and view the complete annual report
Please find page 180 of the 2006 HSBC annual report below. You can navigate through the pages in the report by either clicking on the pages listed below, or by using the keyword search tool below to find specific information within the annual report.-
 1
1 -
2
-
3
-
4
-
5
-
6
-
7
-
8
-
9
-
10
-
11
-
12
-
13
-
14
-
15
-
16
-
17
-
18
-
19
-
20
-
21
-
22
-
23
-
24
-
25
-
26
-
27
-
28
-
29
-
30
-
31
-
32
-
33
-
34
-
35
-
36
-
37
-
38
-
39
-
40
-
41
-
42
-
43
-
44
-
45
-
46
-
47
-
48
-
49
-
50
-
51
-
52
-
53
-
54
-
55
-
56
-
57
-
58
-
59
-
60
-
61
-
62
-
63
-
64
-
65
-
66
-
67
-
68
-
69
-
70
-
71
-
72
-
73
-
74
-
75
-
76
-
77
-
78
-
79
-
80
-
81
-
82
-
83
-
84
-
85
-
86
-
87
-
88
-
89
-
90
-
91
-
92
-
93
-
94
-
95
-
96
-
97
-
98
-
99
-
100
-
101
-
102
-
103
-
104
-
105
-
106
-
107
-
108
-
109
-
110
-
111
-
112
-
113
-
114
-
115
-
116
-
117
-
118
-
119
-
120
-
121
-
122
-
123
-
124
-
125
-
126
-
127
-
128
-
129
-
130
-
131
-
132
-
133
-
134
-
135
-
136
-
137
-
138
-
139
-
140
-
141
-
142
-
143
-
144
-
145
-
146
-
147
-
148
-
149
-
150
-
151
-
152
-
153
-
154
-
155
-
156
-
157
-
158
-
159
-
160
-
161
-
162
-
163
-
164
-
165
-
166
-
167
-
168
-
169
-
 170
170 -
 171
171 -
 172
172 -
 173
173 -
 174
174 -
 175
175 -
 176
176 -
 177
177 -
 178
178 -
 179
179 -
 180
180 -
 181
181 -
 182
182 -
 183
183 -
 184
184 -
 185
185 -
 186
186 -
 187
187 -
 188
188 -
 189
189 -
 190
190 -
191
-
192
-
193
-
194
-
195
-
196
-
197
-
198
-
199
-
200
-
201
-
202
-
203
-
204
-
205
-
206
-
207
-
208
-
209
-
210
-
211
-
212
-
213
-
214
-
215
-
216
-
217
-
218
-
219
-
220
-
221
-
222
-
223
-
224
-
225
-
226
-
227
-
228
-
229
-
230
-
231
-
232
-
233
-
234
-
235
-
236
-
237
-
238
-
239
-
240
-
241
-
242
-
243
-
244
-
245
-
246
-
247
-
248
-
249
-
250
-
251
-
252
-
253
-
254
-
255
-
256
-
257
-
258
-
259
-
260
-
261
-
262
-
263
-
264
-
265
-
266
-
267
-
268
-
269
-
270
-
271
-
272
-
273
-
274
-
275
-
276
-
277
-
278
-
279
-
280
-
281
-
282
-
283
-
284
-
285
-
286
-
287
-
288
-
289
-
290
-
291
-
292
-
293
-
294
-
295
-
296
-
297
-
298
-
299
-
300
-
301
-
302
-
303
-
304
-
305
-
306
-
307
-
308
-
309
-
310
-
311
-
312
-
313
-
314
-
315
-
316
-
317
-
318
-
319
-
320
-
321
-
322
-
323
-
324
-
325
-
326
-
327
-
328
-
329
-
330
-
331
-
332
-
333
-
334
-
335
-
336
-
337
-
338
-
339
-
340
-
341
-
342
-
343
-
344
-
345
-
346
-
347
-
348
-
349
-
350
-
351
-
352
-
353
-
354
-
355
-
356
-
357
-
358
-
359
-
360
-
361
-
362
-
363
-
364
-
365
-
366
-
367
-
368
-
369
-
370
-
371
-
372
-
373
-
374
-
375
-
376
-
377
-
378
-
379
-
380
-
381
-
382
-
383
-
384
-
385
-
386
-
387
-
388
-
389
-
390
-
391
-
392
-
393
-
394
-
395
-
396
-
397
-
398
-
399
-
400
-
401
-
402
-
403
-
404
-
405
-
406
-
407
-
408
-
409
-
410
-
411
-
412
-
413
-
414
-
415
-
416
-
417
-
418
-
419
-
420
-
421
-
422
-
423
-
424
-
425
-
426
-
427
-
428
-
429
-
430
-
431
-
432
-
433
-
434
-
435
-
436
-
437
-
438
-
439
-
440
-
441
-
442
-
443
-
444
-
445
-
446
-
447
-
448
-
449
-
450
-
451
-
452
-
453
-
454
-
455
-
456
-
457
-
458
 |
 |

HSBC HOLDINGS PLC
Report of the Directors: The Management of Risk
Credit risk > Exposure > 2006
178
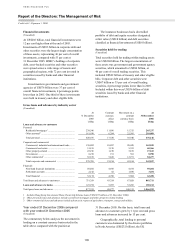
Financial investments
(Unaudited)
At US$205 billion, total financial investments were
12 per cent higher than at the end of 2005.
Investments of US$93 billion in corporate debt and
other securities were the largest single concentration
of these assets, representing 46 per cent of overall
investments, compared with 53 per cent at
31 December 2005. HSBC’s holdings of corporate
debt, asset-backed securities and other securities
were spread across a wide range of issuers and
geographical regions, with 72 per cent invested in
securities issued by banks and other financial
institutions.
Investments in governments and government
agencies of US$76 billion were 37 per cent of
overall financial investments, 4 percentage points
lower than in 2005. One third of these investments
were held in treasury and other eligible bills.
The insurance businesses had a diversified
portfolio of debt and equity securities designated
at fair value (US$18 billion) and debt securities
classified as financial investments (US$10 billion).
Securities held for trading
(Unaudited)
Total securities held for trading within trading assets
were US$204 billion. The largest concentration of
these assets was government and government agency
securities, which amounted to US$94 billion, or
46 per cent of overall trading securities. This
included US$22 billion of treasury and other eligible
bills. Corporate debt and other securities were
US$67 billion or 33 per cent of overall trading
securities, 4 percentage points lower than in 2005.
Included within this were US$36 billion of debt
securities issued by banks and other financial
institutions.
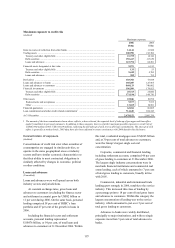
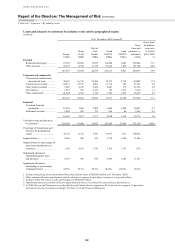
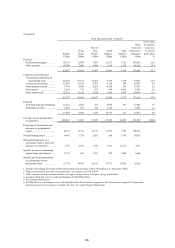
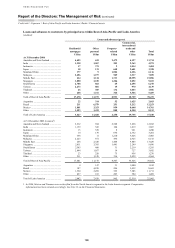
Gross loans and advances by industry sector
(Unaudited)
At
31 December
2005
Constant
currency
effect
Movement on a
constant
currency basis
At
31 December
2006
US$m US$m US$m US$m
Loans and advances to customers
Personal:
Residential mortgages1 ............................................. 238,546 11,036 15,755 265,337
Other personal2 ......................................................... 181,930 6,294 22,585 210,809
Total personal ........................................................... 420,476 17,330 38,340 476,146
Corporate and commercial:
Commercial, industrial and international trade......... 130,802 10,887 20,420 162,109
Commercial real estate ............................................. 51,815 3,158 5,393 60,366
Other property-related .............................................. 22,196 1,150 3,819 27,165
Government .............................................................. 8,218 191 581 8,990
Other commercial3 .................................................... 65,678 5,828 12,971 84,477
Total corporate and commercial .............................. 278,709 21,214 43,184 343,107
Financial:
Non-bank financial institutions ................................ 50,032 4,698 4,474 59,204
Settlement accounts .................................................. 2,142 82 1,030 3,254
Total financial .......................................................... 52,174 4,780 5,504 62,458
Total loans and advances to customers ........................ 751,359 43,324 87,028 881,711
Loans and advances to banks .................................... 125,974 5,953 53,285 185,212
Total gross loans and advances .................................... 877,333 49,277 140,313 1,066,923
1 Includes Hong Kong Government Home Ownership Scheme loans (US$4,078 million at 31 December 2006).
2 Other personal loans and advances include second lien mortgages and other property-related lending.
3 Other commercial loans and advances include advances in respect of agriculture, transport, energy and utilities.
Year ended 31 December 2006 compared
with year ended 31 December 2005
(Unaudited)
The commentary below analyses the movement in
lending on a constant currency basis noted in the
table above compared with the position at
31 December 2005. On this basis, total loans and
advances to customers grew by 11 per cent and gross
loans and advances increased by 15 per cent.
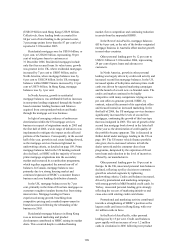
Geographically, total lending to personal
customers was dominated by the diverse portfolios
in North America (US$232 billion), the UK