HSBC 2006 Annual Report Download - page 237
Download and view the complete annual report
Please find page 237 of the 2006 HSBC annual report below. You can navigate through the pages in the report by either clicking on the pages listed below, or by using the keyword search tool below to find specific information within the annual report.-
 1
1 -
2
-
3
-
4
-
5
-
6
-
7
-
8
-
9
-
10
-
11
-
12
-
13
-
14
-
15
-
16
-
17
-
18
-
19
-
20
-
21
-
22
-
23
-
24
-
25
-
26
-
27
-
28
-
29
-
30
-
31
-
32
-
33
-
34
-
35
-
36
-
37
-
38
-
39
-
40
-
41
-
42
-
43
-
44
-
45
-
46
-
47
-
48
-
49
-
50
-
51
-
52
-
53
-
54
-
55
-
56
-
57
-
58
-
59
-
60
-
61
-
62
-
63
-
64
-
65
-
66
-
67
-
68
-
69
-
70
-
71
-
72
-
73
-
74
-
75
-
76
-
77
-
78
-
79
-
80
-
81
-
82
-
83
-
84
-
85
-
86
-
87
-
88
-
89
-
90
-
91
-
92
-
93
-
94
-
95
-
96
-
97
-
98
-
99
-
100
-
101
-
102
-
103
-
104
-
105
-
106
-
107
-
108
-
109
-
110
-
111
-
112
-
113
-
114
-
115
-
116
-
117
-
118
-
119
-
120
-
121
-
122
-
123
-
124
-
125
-
126
-
127
-
128
-
129
-
130
-
131
-
132
-
133
-
134
-
135
-
136
-
137
-
138
-
139
-
140
-
141
-
142
-
143
-
144
-
145
-
146
-
147
-
148
-
149
-
150
-
151
-
152
-
153
-
154
-
155
-
156
-
157
-
158
-
159
-
160
-
161
-
162
-
163
-
164
-
165
-
166
-
167
-
168
-
169
-
170
-
171
-
172
-
173
-
174
-
175
-
176
-
177
-
178
-
179
-
180
-
181
-
182
-
183
-
184
-
185
-
186
-
187
-
188
-
189
-
190
-
191
-
192
-
193
-
194
-
195
-
196
-
197
-
198
-
199
-
200
-
201
-
202
-
203
-
204
-
205
-
206
-
207
-
208
-
209
-
210
-
211
-
212
-
213
-
214
-
215
-
216
-
217
-
218
-
219
-
220
-
221
-
222
-
223
-
224
-
225
-
226
-
 227
227 -
 228
228 -
 229
229 -
 230
230 -
 231
231 -
 232
232 -
 233
233 -
 234
234 -
 235
235 -
 236
236 -
 237
237 -
 238
238 -
 239
239 -
 240
240 -
 241
241 -
 242
242 -
 243
243 -
 244
244 -
 245
245 -
 246
246 -
 247
247 -
248
-
249
-
250
-
251
-
252
-
253
-
254
-
255
-
256
-
257
-
258
-
259
-
260
-
261
-
262
-
263
-
264
-
265
-
266
-
267
-
268
-
269
-
270
-
271
-
272
-
273
-
274
-
275
-
276
-
277
-
278
-
279
-
280
-
281
-
282
-
283
-
284
-
285
-
286
-
287
-
288
-
289
-
290
-
291
-
292
-
293
-
294
-
295
-
296
-
297
-
298
-
299
-
300
-
301
-
302
-
303
-
304
-
305
-
306
-
307
-
308
-
309
-
310
-
311
-
312
-
313
-
314
-
315
-
316
-
317
-
318
-
319
-
320
-
321
-
322
-
323
-
324
-
325
-
326
-
327
-
328
-
329
-
330
-
331
-
332
-
333
-
334
-
335
-
336
-
337
-
338
-
339
-
340
-
341
-
342
-
343
-
344
-
345
-
346
-
347
-
348
-
349
-
350
-
351
-
352
-
353
-
354
-
355
-
356
-
357
-
358
-
359
-
360
-
361
-
362
-
363
-
364
-
365
-
366
-
367
-
368
-
369
-
370
-
371
-
372
-
373
-
374
-
375
-
376
-
377
-
378
-
379
-
380
-
381
-
382
-
383
-
384
-
385
-
386
-
387
-
388
-
389
-
390
-
391
-
392
-
393
-
394
-
395
-
396
-
397
-
398
-
399
-
400
-
401
-
402
-
403
-
404
-
405
-
406
-
407
-
408
-
409
-
410
-
411
-
412
-
413
-
414
-
415
-
416
-
417
-
418
-
419
-
420
-
421
-
422
-
423
-
424
-
425
-
426
-
427
-
428
-
429
-
430
-
431
-
432
-
433
-
434
-
435
-
436
-
437
-
438
-
439
-
440
-
441
-
442
-
443
-
444
-
445
-
446
-
447
-
448
-
449
-
450
-
451
-
452
-
453
-
454
-
455
-
456
-
457
-
458
 |
 |

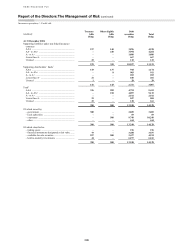
235
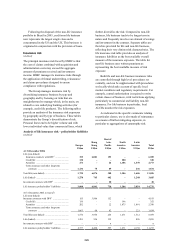
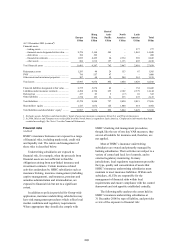
4 Comprises solvency and unencumbered assets.
5 Excludes financial assets of insurance underwriting associates, Erisa, S.A. and Ping An Insurance.
6 Comprises mainly loans and advances to banks and cash.
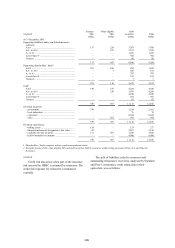
In life linked insurance, premium income less
charges levied is invested in unit-linked funds.
HSBC manages the financial risk of this product by
holding appropriate assets in segregated funds or
portfolios to which the liabilities are linked. This
substantially transfers the financial risk to the
policyholder. The assets held to support life linked
liabilities represented 41.7 per cent of the total
financial assets of HSBC’s insurance underwriting
subsidiaries at the end of 2006 (2005: 35.9 per cent).
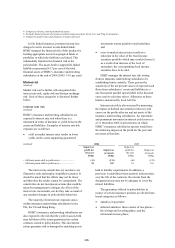
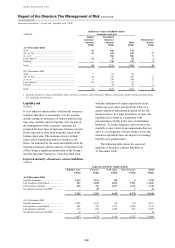
Market risk
(Audited)
Market risk can be further sub-categorised into
interest rate risk, equity risk and foreign exchange
risk. Each of these categories is discussed further
below.
Interest rate risk
(Audited)
HSBC’s insurance underwriting subsidiaries are
exposed to interest rate risk when there is a
mismatch in terms of duration or yields between the
assets and liabilities. Examples of interest rate risk
exposure are as follows:
• a fall in market interest rates results in lower
yields on the assets supporting guaranteed
investment returns payable to policyholders;
and
• a rise in market interest rates results in a
reduction in the value of the fixed income
securities portfolio which may result in losses if,
as a result of an increase of the level of
surrenders, the corresponding fixed income
securities have to be sold.
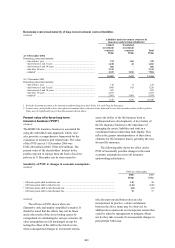
HSBC manages the interest rate risk arising
from its insurance underwriting subsidiaries by
establishing limits centrally. These govern the
sensitivity of the net present values of expected cash
flows from subsidiaries’ assets and liabilities to a
one basis point parallel upward shift in the discount
curve used to calculate values. Adherence to these
limits is monitored by local ALCOs.
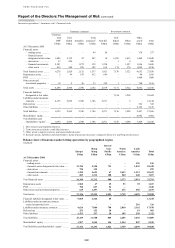
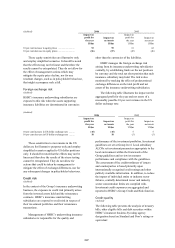
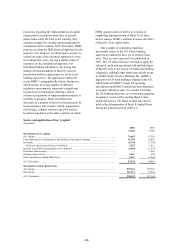
Interest rate risk is also assessed by measuring
the impact of defined movements in interest yield
curves on the profits after tax and net assets of the
insurance underwriting subsidiaries. An immediate
and permanent movement in interest yield curves as
at 31 December 2006 in all territories in which
HSBC’s insurance subsidiaries operate would have
the following impact on the profit for the year and
net assets at that date:
(Audited) 2006 2005
Impact on
profit for
the year
Impact on
net assets
Impact on
profit for
the year
Impact on
net assets
US$m US$m US$m US$m
+ 100 basis points shift in yield curves ........................ (13) (111) (46) (122)
– 100 basis points shift in yield curves ......................... 24 103 63 181
The interest rate sensitivities set out above are
illustrative only and employ simplified scenarios. It
should be noted that the effects may not be linear
and therefore the results cannot be extrapolated. The
sensitivities do not incorporate actions that could be
taken by management to mitigate the effect of the
interest rate movements, nor do they take account of
any resultant changes in policyholder behaviour.
The majority of interest rate exposure arises
within insurance underwriting subsidiaries in the
UK, the US and Hong Kong.
HSBC’s insurance underwriting subsidiaries are
also exposed to the risk that the yield on assets held
may fall short of the return guaranteed on certain
contracts issued to policyholders. This investment
return guarantee risk is managed by matching assets
held to liability requirements. In addition, a
provision is established when analysis indicates that,
over the life of the contracts, the returns from the
designated assets may not be adequate to cover the
related liabilities.
The guarantees offered to policyholders in
respect of certain insurance products are divided into
broad categories as follows:
• annuities in payment;
• deferred annuities: these consist of two phases –
the savings and investing phase, and the
retirement income phase;