HSBC 2006 Annual Report Download - page 163
Download and view the complete annual report
Please find page 163 of the 2006 HSBC annual report below. You can navigate through the pages in the report by either clicking on the pages listed below, or by using the keyword search tool below to find specific information within the annual report.-
 1
1 -
2
-
3
-
4
-
5
-
6
-
7
-
8
-
9
-
10
-
11
-
12
-
13
-
14
-
15
-
16
-
17
-
18
-
19
-
20
-
21
-
22
-
23
-
24
-
25
-
26
-
27
-
28
-
29
-
30
-
31
-
32
-
33
-
34
-
35
-
36
-
37
-
38
-
39
-
40
-
41
-
42
-
43
-
44
-
45
-
46
-
47
-
48
-
49
-
50
-
51
-
52
-
53
-
54
-
55
-
56
-
57
-
58
-
59
-
60
-
61
-
62
-
63
-
64
-
65
-
66
-
67
-
68
-
69
-
70
-
71
-
72
-
73
-
74
-
75
-
76
-
77
-
78
-
79
-
80
-
81
-
82
-
83
-
84
-
85
-
86
-
87
-
88
-
89
-
90
-
91
-
92
-
93
-
94
-
95
-
96
-
97
-
98
-
99
-
100
-
101
-
102
-
103
-
104
-
105
-
106
-
107
-
108
-
109
-
110
-
111
-
112
-
113
-
114
-
115
-
116
-
117
-
118
-
119
-
120
-
121
-
122
-
123
-
124
-
125
-
126
-
127
-
128
-
129
-
130
-
131
-
132
-
133
-
134
-
135
-
136
-
137
-
138
-
139
-
140
-
141
-
142
-
143
-
144
-
145
-
146
-
147
-
148
-
149
-
150
-
151
-
152
-
 153
153 -
 154
154 -
 155
155 -
 156
156 -
 157
157 -
 158
158 -
 159
159 -
 160
160 -
 161
161 -
 162
162 -
 163
163 -
 164
164 -
 165
165 -
 166
166 -
 167
167 -
 168
168 -
 169
169 -
 170
170 -
 171
171 -
 172
172 -
 173
173 -
174
-
175
-
176
-
177
-
178
-
179
-
180
-
181
-
182
-
183
-
184
-
185
-
186
-
187
-
188
-
189
-
190
-
191
-
192
-
193
-
194
-
195
-
196
-
197
-
198
-
199
-
200
-
201
-
202
-
203
-
204
-
205
-
206
-
207
-
208
-
209
-
210
-
211
-
212
-
213
-
214
-
215
-
216
-
217
-
218
-
219
-
220
-
221
-
222
-
223
-
224
-
225
-
226
-
227
-
228
-
229
-
230
-
231
-
232
-
233
-
234
-
235
-
236
-
237
-
238
-
239
-
240
-
241
-
242
-
243
-
244
-
245
-
246
-
247
-
248
-
249
-
250
-
251
-
252
-
253
-
254
-
255
-
256
-
257
-
258
-
259
-
260
-
261
-
262
-
263
-
264
-
265
-
266
-
267
-
268
-
269
-
270
-
271
-
272
-
273
-
274
-
275
-
276
-
277
-
278
-
279
-
280
-
281
-
282
-
283
-
284
-
285
-
286
-
287
-
288
-
289
-
290
-
291
-
292
-
293
-
294
-
295
-
296
-
297
-
298
-
299
-
300
-
301
-
302
-
303
-
304
-
305
-
306
-
307
-
308
-
309
-
310
-
311
-
312
-
313
-
314
-
315
-
316
-
317
-
318
-
319
-
320
-
321
-
322
-
323
-
324
-
325
-
326
-
327
-
328
-
329
-
330
-
331
-
332
-
333
-
334
-
335
-
336
-
337
-
338
-
339
-
340
-
341
-
342
-
343
-
344
-
345
-
346
-
347
-
348
-
349
-
350
-
351
-
352
-
353
-
354
-
355
-
356
-
357
-
358
-
359
-
360
-
361
-
362
-
363
-
364
-
365
-
366
-
367
-
368
-
369
-
370
-
371
-
372
-
373
-
374
-
375
-
376
-
377
-
378
-
379
-
380
-
381
-
382
-
383
-
384
-
385
-
386
-
387
-
388
-
389
-
390
-
391
-
392
-
393
-
394
-
395
-
396
-
397
-
398
-
399
-
400
-
401
-
402
-
403
-
404
-
405
-
406
-
407
-
408
-
409
-
410
-
411
-
412
-
413
-
414
-
415
-
416
-
417
-
418
-
419
-
420
-
421
-
422
-
423
-
424
-
425
-
426
-
427
-
428
-
429
-
430
-
431
-
432
-
433
-
434
-
435
-
436
-
437
-
438
-
439
-
440
-
441
-
442
-
443
-
444
-
445
-
446
-
447
-
448
-
449
-
450
-
451
-
452
-
453
-
454
-
455
-
456
-
457
-
458
 |
 |

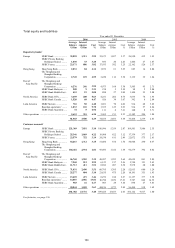
161
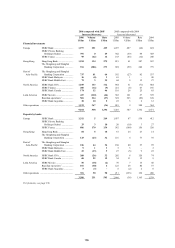
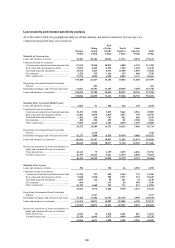
Year ended 31 December
2006 2005 2004
Average
balance
Average
rate
Average
balance
Average
rate
Average
balance
Average
rate
US$m % US$m % US$m %
Customer accounts
Europe
Demand and other – non-interest
bearing ................................................ 33,000 – 28,501 –
37,184 –
Demand – interest bearing ..................... 173,150 2.7 146,484 2.4 128,249 2.0
Savings ................................................... 50,525 3.9 46,248 3.3 37,846 2.5
Time ........................................................ 59,374 4.2 48,201 3.9 47,941 3.1
Other ....................................................... 9,249 4.1 10,967 2.7 15,167 2.2
325,298 280,401 266,387
Hong Kong
Demand and other – non-interest
bearing ................................................ 12,362 – 13,365 –
13,508 –
Demand – interest bearing ..................... 88,754 2.4 91,723 0.9 94,629 0.1
Savings ................................................... 58,883 3.8 50,281 2.4 46,817 1.0
Time ........................................................ 20,454 3.6 14,054 2.7 12,015 1.6
Other ....................................................... 51 3.9 15 6.7 106 4.7
181,153 169,438 167,075
Rest of Asia-Pacific
Demand and other – non-interest
bearing ................................................ 13,107 – 11,825 –
8,592 –
Demand – interest bearing ..................... 29,816 2.1 27,721 1.7 24,480 1.2
Savings ................................................... 42,153 4.3 31,584 3.3 27,171 2.9
Time ........................................................ 10,246 4.5 10,484 3.5 7,597 2.1
Other ....................................................... 2,233 3.5 1,895 3.9 2,866 1.2
97,555 83,509 70,706
North America
Demand and other – non-interest
bearing ................................................ 13,662 – 13,627 –
18,735 –
Demand – interest bearing ..................... 14,406 2.9 11,723 1.9 10,730 1.1
Savings ................................................... 65,216 2.8 52,458 1.6 51,780 1.3
Time ........................................................ 21,124 5.4 21,759 3.6 12,267 2.1
Other ....................................................... 3,339 2.0 2,549 4.5 13,119 1.6
117,747 102,116 106,631
Latin America
Demand and other – non-interest
bearing ................................................ 7,995 – 5,583 –
4,201 –
Demand – interest bearing ..................... 5,438 1.6 6,341 1.2 5,973 1.1
Savings ................................................... 16,512 11.3 10,980 15.2 7,115 11.5
Time ........................................................ 7,665 5.9 2,529 5.6 1,973 3.6
Other ....................................................... 2,145 13.4 1,429 17.5 4,281 7.4
39,757 26,862 23,543
Total
Demand and other – non-interest
bearing ................................................ 80,126 – 72,901 –
82,220 –
Demand – interest bearing ..................... 311,564 2.6 283,992 1.8 264,061 1.2
Savings ................................................... 233,289 4.1 191,551 3.3 170,729 2.2
Time ........................................................ 118,863 4.5 97,027 3.7 81,793 2.6
Other ....................................................... 17,666 4.6 16,855 4.4 35,539 2.5
761,510 662,326 634,342
CDs and other money market instruments
Europe ............................................................ 48,238 4.2 27,778 5.8 24,684 2.6
Hong Kong .................................................... 1,191 3.5 1,599 3.1 10,031 3.3
Rest of Asia-Pacific ....................................... 6,621 5.6 7,467 6.2 6,804 4.4
North America ............................................... 23,472 4.6 19,566 3.1 17,224 1.8
Latin America ................................................ 318 10.7 4,657 6.4 3,668 4.1
79,840 4.5 61,067 5.0 62,411 2.9