HSBC 2006 Annual Report Download - page 20
Download and view the complete annual report
Please find page 20 of the 2006 HSBC annual report below. You can navigate through the pages in the report by either clicking on the pages listed below, or by using the keyword search tool below to find specific information within the annual report.-
 1
1 -
2
-
3
-
4
-
5
-
6
-
7
-
8
-
9
-
 10
10 -
 11
11 -
 12
12 -
 13
13 -
 14
14 -
 15
15 -
 16
16 -
 17
17 -
 18
18 -
 19
19 -
 20
20 -
 21
21 -
 22
22 -
 23
23 -
 24
24 -
 25
25 -
 26
26 -
 27
27 -
 28
28 -
 29
29 -
 30
30 -
31
-
32
-
33
-
34
-
35
-
36
-
37
-
38
-
39
-
40
-
41
-
42
-
43
-
44
-
45
-
46
-
47
-
48
-
49
-
50
-
51
-
52
-
53
-
54
-
55
-
56
-
57
-
58
-
59
-
60
-
61
-
62
-
63
-
64
-
65
-
66
-
67
-
68
-
69
-
70
-
71
-
72
-
73
-
74
-
75
-
76
-
77
-
78
-
79
-
80
-
81
-
82
-
83
-
84
-
85
-
86
-
87
-
88
-
89
-
90
-
91
-
92
-
93
-
94
-
95
-
96
-
97
-
98
-
99
-
100
-
101
-
102
-
103
-
104
-
105
-
106
-
107
-
108
-
109
-
110
-
111
-
112
-
113
-
114
-
115
-
116
-
117
-
118
-
119
-
120
-
121
-
122
-
123
-
124
-
125
-
126
-
127
-
128
-
129
-
130
-
131
-
132
-
133
-
134
-
135
-
136
-
137
-
138
-
139
-
140
-
141
-
142
-
143
-
144
-
145
-
146
-
147
-
148
-
149
-
150
-
151
-
152
-
153
-
154
-
155
-
156
-
157
-
158
-
159
-
160
-
161
-
162
-
163
-
164
-
165
-
166
-
167
-
168
-
169
-
170
-
171
-
172
-
173
-
174
-
175
-
176
-
177
-
178
-
179
-
180
-
181
-
182
-
183
-
184
-
185
-
186
-
187
-
188
-
189
-
190
-
191
-
192
-
193
-
194
-
195
-
196
-
197
-
198
-
199
-
200
-
201
-
202
-
203
-
204
-
205
-
206
-
207
-
208
-
209
-
210
-
211
-
212
-
213
-
214
-
215
-
216
-
217
-
218
-
219
-
220
-
221
-
222
-
223
-
224
-
225
-
226
-
227
-
228
-
229
-
230
-
231
-
232
-
233
-
234
-
235
-
236
-
237
-
238
-
239
-
240
-
241
-
242
-
243
-
244
-
245
-
246
-
247
-
248
-
249
-
250
-
251
-
252
-
253
-
254
-
255
-
256
-
257
-
258
-
259
-
260
-
261
-
262
-
263
-
264
-
265
-
266
-
267
-
268
-
269
-
270
-
271
-
272
-
273
-
274
-
275
-
276
-
277
-
278
-
279
-
280
-
281
-
282
-
283
-
284
-
285
-
286
-
287
-
288
-
289
-
290
-
291
-
292
-
293
-
294
-
295
-
296
-
297
-
298
-
299
-
300
-
301
-
302
-
303
-
304
-
305
-
306
-
307
-
308
-
309
-
310
-
311
-
312
-
313
-
314
-
315
-
316
-
317
-
318
-
319
-
320
-
321
-
322
-
323
-
324
-
325
-
326
-
327
-
328
-
329
-
330
-
331
-
332
-
333
-
334
-
335
-
336
-
337
-
338
-
339
-
340
-
341
-
342
-
343
-
344
-
345
-
346
-
347
-
348
-
349
-
350
-
351
-
352
-
353
-
354
-
355
-
356
-
357
-
358
-
359
-
360
-
361
-
362
-
363
-
364
-
365
-
366
-
367
-
368
-
369
-
370
-
371
-
372
-
373
-
374
-
375
-
376
-
377
-
378
-
379
-
380
-
381
-
382
-
383
-
384
-
385
-
386
-
387
-
388
-
389
-
390
-
391
-
392
-
393
-
394
-
395
-
396
-
397
-
398
-
399
-
400
-
401
-
402
-
403
-
404
-
405
-
406
-
407
-
408
-
409
-
410
-
411
-
412
-
413
-
414
-
415
-
416
-
417
-
418
-
419
-
420
-
421
-
422
-
423
-
424
-
425
-
426
-
427
-
428
-
429
-
430
-
431
-
432
-
433
-
434
-
435
-
436
-
437
-
438
-
439
-
440
-
441
-
442
-
443
-
444
-
445
-
446
-
447
-
448
-
449
-
450
-
451
-
452
-
453
-
454
-
455
-
456
-
457
-
458
 |
 |

HSBC HOLDINGS PLC
Report of the Directors: Business Review (continued)
Business highlights
18
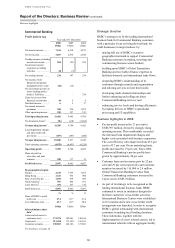
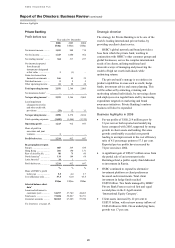
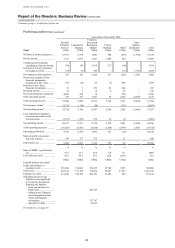
Corporate, Investment Banking and Markets
Profit before tax
Year ended 31 December
2006 2005 2004
US$m US$m US$m
Net interest income ......... 3,168 3,001 3,994
Net fee income ................ 3,718 2,967 2,764
Trading income excluding
net interest income ....... 4,890 2,919 1,935
Net interest income/
(expense) on trading
activities ....................... (379) 306 –
Net trading income1 ........ 4,511 3,225 1,935
Net income from financial
instruments designated
at fair value .................. 20 67 –
Net investment income on
assets backing policy-
holders’ liabilities ........ – – 9
Gains less losses from
financial investments ... 534 475 197
Dividend income ............. 235 79 548
Net earned insurance
premiums ...................... 73 76 86
Other operating income .. 1,378 1,621 1,029
Total operating income 13,637 11,511 10,562
Net insurance claims2 ..... (62) (54) (59)
Net operating income3... 13,575 11,457 10,503
Net recovery of loan
impairment charges
and other credit risk
provisions ..................... 119 272 499
Net operating income .... 13,694 11,729 11,002
Total operating expenses (7,991) (6,838) (5,809)
Operating profit ............ 5,703 4,891 5,193
Share of profit in
associates and joint
ventures ........................ 103 272 95
Profit before tax ............ 5,806 5,163 5,288
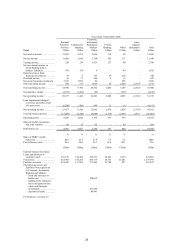
By geographical region
Europe ............................. 2,304 2,114 1,668
Hong Kong ...................... 955 922 1,603
Rest of Asia-Pacific ........ 1,649 1,207 942
North America4 ............... 423 573 879
Latin America4 ................ 475 347 196
Profit before tax .............. 5,806 5,163 5,288
% % %
Share of HSBC’s profit
before tax ..................... 26.3
24.6 27.9
Cost efficiency ratio ........ 58.9 59.7 55.3
For footnotes, see page 26.
Strategic direction
HSBC’s strategy is to be a leading wholesale bank
by focusing on financing and emerging markets, and:
– leveraging the Group’s unique footprint and
heritage;
– using HSBC’s network and client franchises as
the foundation on which Corporate, Investment
Banking and Markets develops its hub-and-
spoke business model; and
– continuing to build skills and capabilities in its
major centres to support the delivery of an
advanced suite of services to corporate,
institutional and government clients across the
HSBC network.
Ensuring that this combination of product depth
and distribution strength meets the needs of existing
and new clients will allow Corporate, Investment
Banking and Markets to achieve its strategic goals.
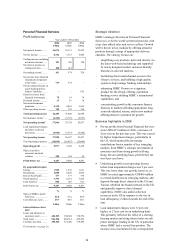
Business highlights in 2006
• Pre-tax profit rose by 12 per cent to
US$5,806 million, driven by an 18 per cent
increase in total operating income. This was
achieved despite a declining contribution from
balance sheet management activities, which fell
by US$534 million as existing positions
unwound and opportunities for reinvestment
were limited by the flat interest rate yield curve
environment. On an underlying basis and
excluding balance sheet management activities,
total operating income improved by 24 per cent,
reflecting positive revenue trends in product
areas in which HSBC has invested. The increase
in operating expenses reflected the first full-year
effect of recruitment in 2005. Performance-
related compensation increased in line with
robust revenue growth, while higher operational
costs reflected volume increases in payments
and cash management and securities services.
The cost efficiency ratio improved moderately.
In 2006, over 1,700 people were recruited and
1,150 departed.
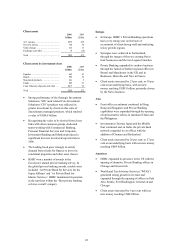
• Corporate, Investment Banking and Markets’
strength in emerging markets was recognised by
industry awards. HSBC was named European
Loan House of the Year, China Loan House of
the Year and Asian Domestic Currency Bond
House of the Year by International Financing
Review. Mittal Steel’s acquisition of Arcelor, in
which HSBC held senior financing and advisory
roles, was voted European mergers and
acquisitions Deal of the Year by Financial News
and Cross-Border Deal of the Year by