HSBC 2006 Annual Report Download - page 183
Download and view the complete annual report
Please find page 183 of the 2006 HSBC annual report below. You can navigate through the pages in the report by either clicking on the pages listed below, or by using the keyword search tool below to find specific information within the annual report.-
 1
1 -
2
-
3
-
4
-
5
-
6
-
7
-
8
-
9
-
10
-
11
-
12
-
13
-
14
-
15
-
16
-
17
-
18
-
19
-
20
-
21
-
22
-
23
-
24
-
25
-
26
-
27
-
28
-
29
-
30
-
31
-
32
-
33
-
34
-
35
-
36
-
37
-
38
-
39
-
40
-
41
-
42
-
43
-
44
-
45
-
46
-
47
-
48
-
49
-
50
-
51
-
52
-
53
-
54
-
55
-
56
-
57
-
58
-
59
-
60
-
61
-
62
-
63
-
64
-
65
-
66
-
67
-
68
-
69
-
70
-
71
-
72
-
73
-
74
-
75
-
76
-
77
-
78
-
79
-
80
-
81
-
82
-
83
-
84
-
85
-
86
-
87
-
88
-
89
-
90
-
91
-
92
-
93
-
94
-
95
-
96
-
97
-
98
-
99
-
100
-
101
-
102
-
103
-
104
-
105
-
106
-
107
-
108
-
109
-
110
-
111
-
112
-
113
-
114
-
115
-
116
-
117
-
118
-
119
-
120
-
121
-
122
-
123
-
124
-
125
-
126
-
127
-
128
-
129
-
130
-
131
-
132
-
133
-
134
-
135
-
136
-
137
-
138
-
139
-
140
-
141
-
142
-
143
-
144
-
145
-
146
-
147
-
148
-
149
-
150
-
151
-
152
-
153
-
154
-
155
-
156
-
157
-
158
-
159
-
160
-
161
-
162
-
163
-
164
-
165
-
166
-
167
-
168
-
169
-
170
-
171
-
172
-
 173
173 -
 174
174 -
 175
175 -
 176
176 -
 177
177 -
 178
178 -
 179
179 -
 180
180 -
 181
181 -
 182
182 -
 183
183 -
 184
184 -
 185
185 -
 186
186 -
 187
187 -
 188
188 -
 189
189 -
 190
190 -
 191
191 -
 192
192 -
 193
193 -
194
-
195
-
196
-
197
-
198
-
199
-
200
-
201
-
202
-
203
-
204
-
205
-
206
-
207
-
208
-
209
-
210
-
211
-
212
-
213
-
214
-
215
-
216
-
217
-
218
-
219
-
220
-
221
-
222
-
223
-
224
-
225
-
226
-
227
-
228
-
229
-
230
-
231
-
232
-
233
-
234
-
235
-
236
-
237
-
238
-
239
-
240
-
241
-
242
-
243
-
244
-
245
-
246
-
247
-
248
-
249
-
250
-
251
-
252
-
253
-
254
-
255
-
256
-
257
-
258
-
259
-
260
-
261
-
262
-
263
-
264
-
265
-
266
-
267
-
268
-
269
-
270
-
271
-
272
-
273
-
274
-
275
-
276
-
277
-
278
-
279
-
280
-
281
-
282
-
283
-
284
-
285
-
286
-
287
-
288
-
289
-
290
-
291
-
292
-
293
-
294
-
295
-
296
-
297
-
298
-
299
-
300
-
301
-
302
-
303
-
304
-
305
-
306
-
307
-
308
-
309
-
310
-
311
-
312
-
313
-
314
-
315
-
316
-
317
-
318
-
319
-
320
-
321
-
322
-
323
-
324
-
325
-
326
-
327
-
328
-
329
-
330
-
331
-
332
-
333
-
334
-
335
-
336
-
337
-
338
-
339
-
340
-
341
-
342
-
343
-
344
-
345
-
346
-
347
-
348
-
349
-
350
-
351
-
352
-
353
-
354
-
355
-
356
-
357
-
358
-
359
-
360
-
361
-
362
-
363
-
364
-
365
-
366
-
367
-
368
-
369
-
370
-
371
-
372
-
373
-
374
-
375
-
376
-
377
-
378
-
379
-
380
-
381
-
382
-
383
-
384
-
385
-
386
-
387
-
388
-
389
-
390
-
391
-
392
-
393
-
394
-
395
-
396
-
397
-
398
-
399
-
400
-
401
-
402
-
403
-
404
-
405
-
406
-
407
-
408
-
409
-
410
-
411
-
412
-
413
-
414
-
415
-
416
-
417
-
418
-
419
-
420
-
421
-
422
-
423
-
424
-
425
-
426
-
427
-
428
-
429
-
430
-
431
-
432
-
433
-
434
-
435
-
436
-
437
-
438
-
439
-
440
-
441
-
442
-
443
-
444
-
445
-
446
-
447
-
448
-
449
-
450
-
451
-
452
-
453
-
454
-
455
-
456
-
457
-
458
 |
 |

181
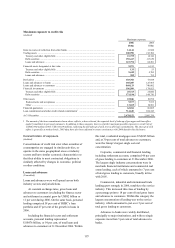
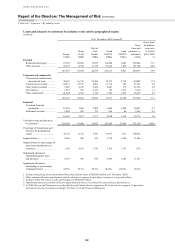
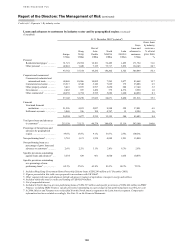
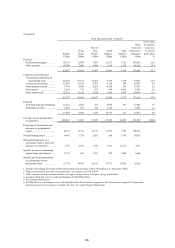
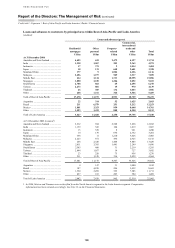
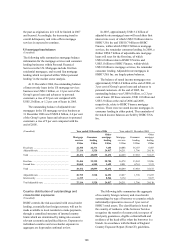
Loans and advances to customers by industry sector and by geographical region
(Audited)
At 31 December 2006
Europe
Hong
Kong
Rest of
Asia-
Pacific
North
America
Latin
America
Gross
loans and
advances to
customers
Gross loans
by industry
sector as a
% of total
gross loans
US$m US$m US$m US$m US$m US$m %
Personal
Residential mortgages1 ............ 91,534 28,743 17,478 123,955 3,627 265,337 30.1
Other personal ......................... 67,214 10,396 13,275 108,256 11,668 210,809 23.9
158,748 39,139 30,753 232,211 15,295 476,146 54.0
Corporate and commercial
Commercial, industrial and
international trade ............... 99,027 16,845 25,196 11,004 10,037 162,109 18.4
Commercial real estate ............ 28,655 12,481 5,502 12,782 946 60,366 6.8
Other property-related ............. 9,616 6,923 3,491 5,931 1,204 27,165 3.1
Government ............................. 2,360 551 1,916 220 3,943 8,990 1.0
Other commercial2 ................... 56,650 5,553 8,468 9,736 4,070 84,477 9.6
196,308 42,353 44,573 39,673 20,200 343,107 38.9
Financial
Non-bank financial
institutions ........................... 40,055 2,332 2,926 12,258 1,633 59,204 6.7
Settlement accounts ................. 1,064 823 223 1,092 52 3,254 0.4
41,119 3,155 3,149 13,350 1,685 62,458 7.1
Total gross loans and advances
to customers3............................ 396,175 84,647 78,475 285,234 37,180 881,711 100.0
Percentage of Group loans and
advances by geographical
region ....................................... 44.9% 9.6% 8.9% 32.4% 4.2% 100.0%
Impaired loans ............................. 5,847 454 1,184 4,822 1,478 13,785
Impaired loans as a percentage of
gross loans and advances to
customers ................................. 1.5% 0.5% 1.5% 1.7% 4.0% 1.6%
Impairment allowances
outstanding against loans
and advances4 .......................... 3,676 365 901 7,247 1,389 13,578
Impairment allowances
outstanding as a percentage
of impaired loans4 .................... 62.9% 80.4% 76.1% 150.3% 94.0% 98.5%
1 Includes Hong Kong Government Home Ownership Scheme loans (US$4,078 million at 31 December 2006).
2 Other commercial loans and advances include advances in respect of agriculture, transport, energy and utilities.
3 Included within this total is credit card lending of US$74,518 million.
4 Impairment allowances include collective impairment allowances on collectively assessed loans and advances.
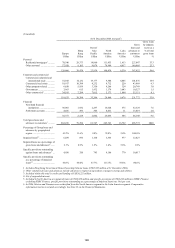
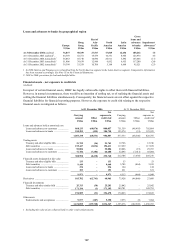
Included in personal lending in North America are the following balances relating to the US:
At 31 December
(Unaudited) 2006
US$m
2005
US$m
Residential mortgages – HSBC Bank USA ........................................................................................ 31,589 36,170
Residential mortgages – HSBC Finance ............................................................................................. 75,903 67,359
Motor vehicle finance .......................................................................................................................... 13,146 12,792
MasterCard/Visa credit cards .............................................................................................................. 29,269 26,795
Private label cards ................................................................................................................................ 16,645 15,488
Other unsecured personal lending ....................................................................................................... 41,214 35,545
207,766 194,149