HSBC 2006 Annual Report Download - page 162
Download and view the complete annual report
Please find page 162 of the 2006 HSBC annual report below. You can navigate through the pages in the report by either clicking on the pages listed below, or by using the keyword search tool below to find specific information within the annual report.-
 1
1 -
2
-
3
-
4
-
5
-
6
-
7
-
8
-
9
-
10
-
11
-
12
-
13
-
14
-
15
-
16
-
17
-
18
-
19
-
20
-
21
-
22
-
23
-
24
-
25
-
26
-
27
-
28
-
29
-
30
-
31
-
32
-
33
-
34
-
35
-
36
-
37
-
38
-
39
-
40
-
41
-
42
-
43
-
44
-
45
-
46
-
47
-
48
-
49
-
50
-
51
-
52
-
53
-
54
-
55
-
56
-
57
-
58
-
59
-
60
-
61
-
62
-
63
-
64
-
65
-
66
-
67
-
68
-
69
-
70
-
71
-
72
-
73
-
74
-
75
-
76
-
77
-
78
-
79
-
80
-
81
-
82
-
83
-
84
-
85
-
86
-
87
-
88
-
89
-
90
-
91
-
92
-
93
-
94
-
95
-
96
-
97
-
98
-
99
-
100
-
101
-
102
-
103
-
104
-
105
-
106
-
107
-
108
-
109
-
110
-
111
-
112
-
113
-
114
-
115
-
116
-
117
-
118
-
119
-
120
-
121
-
122
-
123
-
124
-
125
-
126
-
127
-
128
-
129
-
130
-
131
-
132
-
133
-
134
-
135
-
136
-
137
-
138
-
139
-
140
-
141
-
142
-
143
-
144
-
145
-
146
-
147
-
148
-
149
-
150
-
151
-
 152
152 -
 153
153 -
 154
154 -
 155
155 -
 156
156 -
 157
157 -
 158
158 -
 159
159 -
 160
160 -
 161
161 -
 162
162 -
 163
163 -
 164
164 -
 165
165 -
 166
166 -
 167
167 -
 168
168 -
 169
169 -
 170
170 -
 171
171 -
 172
172 -
173
-
174
-
175
-
176
-
177
-
178
-
179
-
180
-
181
-
182
-
183
-
184
-
185
-
186
-
187
-
188
-
189
-
190
-
191
-
192
-
193
-
194
-
195
-
196
-
197
-
198
-
199
-
200
-
201
-
202
-
203
-
204
-
205
-
206
-
207
-
208
-
209
-
210
-
211
-
212
-
213
-
214
-
215
-
216
-
217
-
218
-
219
-
220
-
221
-
222
-
223
-
224
-
225
-
226
-
227
-
228
-
229
-
230
-
231
-
232
-
233
-
234
-
235
-
236
-
237
-
238
-
239
-
240
-
241
-
242
-
243
-
244
-
245
-
246
-
247
-
248
-
249
-
250
-
251
-
252
-
253
-
254
-
255
-
256
-
257
-
258
-
259
-
260
-
261
-
262
-
263
-
264
-
265
-
266
-
267
-
268
-
269
-
270
-
271
-
272
-
273
-
274
-
275
-
276
-
277
-
278
-
279
-
280
-
281
-
282
-
283
-
284
-
285
-
286
-
287
-
288
-
289
-
290
-
291
-
292
-
293
-
294
-
295
-
296
-
297
-
298
-
299
-
300
-
301
-
302
-
303
-
304
-
305
-
306
-
307
-
308
-
309
-
310
-
311
-
312
-
313
-
314
-
315
-
316
-
317
-
318
-
319
-
320
-
321
-
322
-
323
-
324
-
325
-
326
-
327
-
328
-
329
-
330
-
331
-
332
-
333
-
334
-
335
-
336
-
337
-
338
-
339
-
340
-
341
-
342
-
343
-
344
-
345
-
346
-
347
-
348
-
349
-
350
-
351
-
352
-
353
-
354
-
355
-
356
-
357
-
358
-
359
-
360
-
361
-
362
-
363
-
364
-
365
-
366
-
367
-
368
-
369
-
370
-
371
-
372
-
373
-
374
-
375
-
376
-
377
-
378
-
379
-
380
-
381
-
382
-
383
-
384
-
385
-
386
-
387
-
388
-
389
-
390
-
391
-
392
-
393
-
394
-
395
-
396
-
397
-
398
-
399
-
400
-
401
-
402
-
403
-
404
-
405
-
406
-
407
-
408
-
409
-
410
-
411
-
412
-
413
-
414
-
415
-
416
-
417
-
418
-
419
-
420
-
421
-
422
-
423
-
424
-
425
-
426
-
427
-
428
-
429
-
430
-
431
-
432
-
433
-
434
-
435
-
436
-
437
-
438
-
439
-
440
-
441
-
442
-
443
-
444
-
445
-
446
-
447
-
448
-
449
-
450
-
451
-
452
-
453
-
454
-
455
-
456
-
457
-
458
 |
 |

HSBC HOLDINGS PLC
Report of the Directors: Financial Review (continued)
Other financial information > Deposits
160
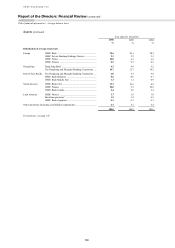
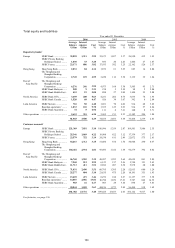
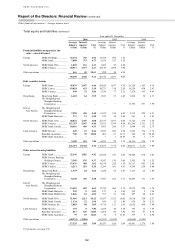
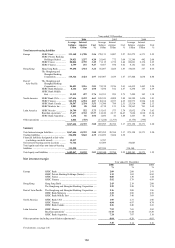
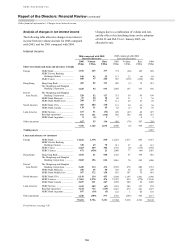
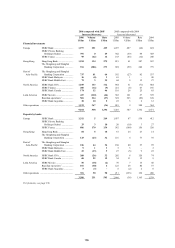
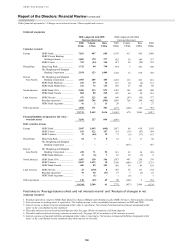
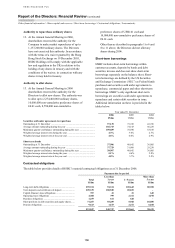
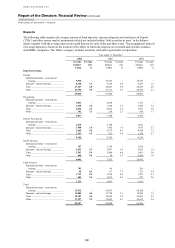
Deposits
The following tables analyse the average amount of bank deposits, customer deposits and certificates of deposit
(‘CDs’) and other money market instruments (which are included within ‘debt securities in issue’ in the balance
sheet), together with the average interest rates paid thereon for each of the past three years. The geographical analysis
of average deposits is based on the location of the office in which the deposits are recorded and excludes balances
with HSBC companies. The ‘Other’ category includes securities sold under agreements to repurchase.
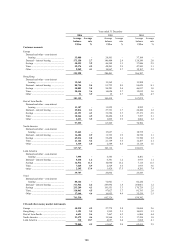
Year ended 31 December
2006 2005 2004
Average
balance
Average
rate
Average
balance
Average
rate
Average
balance
Average
rate
US$m % US$m % US$m %
Deposits by banks
Europe
Demand and other – non-interest
bearing ................................................ 9,814 – 14,252 –
14,746 –
Demand – interest bearing ..................... 8,368 3.7 9,418 2.9 9,237 1.5
Time ........................................................ 27,447 4.0 28,021 3.0 22,029 2.8
Other ....................................................... 23,396 3.5 16,111 3.6 22,870 2.5
69,025 67,802 68,882
Hong Kong
Demand and other – non-interest
bearing ................................................ 1,031 – 2,054 –
1,752 –
Demand – interest bearing ..................... 2,428 4.6 3,104 3.5 2,484 1.2
Time ........................................................ 2,016 4.3 2,012 3.2 1,016 1.6
Other ....................................................... 362 3.3 218 2.3 416 1.7
5,837 7,388 5,668
Rest of Asia-Pacific
Demand and other – non-interest
bearing ................................................ 1,618 – 2,164 –
1,641 –
Demand – interest bearing ..................... 1,960 2.4 1,442 1.9 1,013 2.3
Time ........................................................ 3,645 4.8 4,375 4.3 4,410 3.1
Other ....................................................... 2,157 4.5 761 5.4 1,146 2.7
9,380 8,742 8,210
North America
Demand and other – non-interest
bearing ................................................ 767 – 1,334 –
1,670 –
Demand – interest bearing ..................... 3,033 5.3 3,647 3.6 3,025 1.4
Time ........................................................ 3,543 5.4 2,406 6.0 1,861 3.0
Other ....................................................... 699 5.6 38 5.3 4,436 1.8
8,042 7,425 10,992
Latin America
Demand and other – non-interest
bearing ................................................ 702 – 49 –
291 –
Demand – interest bearing ..................... 96 6.3 117 7.7 221 5.4
Time ........................................................ 1,732 5.5 1,810 6.4 1,553 4.1
Other ....................................................... 683 9.4 1,075 8.9 747 5.6
3,213 3,051 2,812
Total
Demand and other – non-interest
bearing ................................................ 13,932 – 19,853 –
20,100 –
Demand – interest bearing ..................... 15,885 4.5 17,728 3.1 15,980 1.5
Time ........................................................ 38,383 4.5 38,624 3.5 30,869 2.9
Other ....................................................... 27,297 3.9 18,203 4.1 29,615 2.4
95,497 94,408 96,564